



Blueclone Research · New Jersey
Evidence refreshed September 21, 2026Is AI Adoption Outrunning Security in New Jersey Businesses?
A 2025-2026 evidence synthesis of business AI adoption, cybersecurity incidents, breach exposure, regulatory expectations, and the missing governance benchmark.
Chapter 1
Executive Findings & Evidence Model
The evidence supports a serious security-readiness question and a rising exposure surface. It does not support a fabricated statewide AI-security-gap percentage.
Pages 1-8 · problem, denominators, evidence model
The central finding is deliberately narrower than the headline question. New Jersey businesses are using AI at material scale, regional adoption is accelerating in important business segments, and the state's cyber-threat environment is substantial. At the same time, no public statewide dataset reviewed in this report measures AI adoption and security-control maturity in the same New Jersey businesses. [S1][S4][S5][S8][S9]
That means the publication can responsibly describe a growing exposure surface and a measurable governance-data gap. It cannot responsibly claim that a specific percentage of New Jersey AI adopters lacks adequate controls until that numerator and denominator are observed together.
1.1 Evidence model
Four evidence layers answer different parts of the question
Adoption evidence tells us who is using AI and where concentration is highest. Control evidence tells us whether approved policies, complete MFA, data protection, vendor review, monitoring and recovery are actually in place. Threat evidence describes incidents, compromised credentials and other security pressure. Impact evidence describes loss, breach cost and regulatory consequences.
The research problem is the missing join between the first two layers: public sources measure adoption and security pressure, but they do not provide a matched statewide denominator for governance maturity among the same AI-adopting organizations.
Publication-safe conclusion: AI adoption is expanding into a demonstrably high-pressure security environment, but the public evidence does not yet prove that controls are lagging adoption within the same New Jersey businesses.
Evidence modelWhat we know — and the join that is still missing
01AdoptionCensus + Federal Reserve
02ControlsPolicy, MFA, DLP, recovery
03ThreatsNJCCIC, FBI, breach research
04ImpactLosses + enforcement
Missing matched denominatorAI use + control maturityin the same New Jersey organizations
↓
Next research stepMatched NJ organization-level benchmark
1.2 Denominator discipline
The same number can mean very different things depending on the population behind it
The Census BTOS sample framework is approximately 1.2 million employer businesses divided across six panels; it is not 1.2 million completed AI responses per release. NJCCIC incident and breach reports are operational reporting counts, not a census of all New Jersey businesses. FBI IC3 complaints include individuals and organizations. These measures are useful precisely because their roles are kept separate rather than blended into one synthetic percentage. [S1][S8][S9]
Chapter 2
AI Adoption Analysis
State, national, company-size, sector and regional evidence all point to material adoption - with large differences in intensity and concentration.
Pages 9-18 · adoption benchmark and definition discipline

The public evidence shows that AI is established but uneven. The strongest state benchmark in this research pass places New Jersey at 18.5% current AI use in May 2026, with 20.5% expecting to use AI within six months. The corresponding U.S. values were 19.8% and 22.8%. [S4]
The Census question broadened in November 2025 from AI used in producing goods and services to AI used in any business function. That makes the current series more representative of drafting, research and administrative use, but it also creates a series break that should not be ignored. [S2][S3]
2.1 State benchmark
New Jersey is close to the national average
The comparison answers the first practical question: is there enough business adoption for governance to be a present-tense issue? Yes. New Jersey's 18.5% current-use estimate is slightly below the U.S. 19.8% rate, while expected use remains above current use in both populations. [S4]
These are business-level measures. They do not mean 18.5% of workers use AI or that 18.5% of work is AI-assisted.
Current vs expected AI use
May 2026 Census-based values. [S4]
AI adoption by firm size
Observed current-use rates in Census-based May 2026 data. [S4]
2.2 Company size
Larger firms are materially further into adoption
Current AI use rises from roughly 19% among 1-4 employee businesses to 32.0% among firms with 100-249 employees and 37.3% among firms with 250 or more employees. [S4]
This matters for security research because larger organizations usually operate more complex identity estates, vendor relationships, data flows and application portfolios. It does not follow that they are less secure; they may also have stronger security programs. A matched study therefore has to measure exposure and control maturity rather than infer one from size alone.
2.3 Sector concentration
Knowledge-intensive sectors are already well above the national average
Information-sector use reached 39.7% and finance/insurance reached 33.9% in the national May 2026 data, versus 19.8% overall. [S2][S4]
The sector pattern argues against using one statewide headline as the entire story. Knowledge-intensive sectors have moved much further into adoption, while lower-adoption sectors remain useful comparison groups for testing whether control maturity tracks adoption or simply reflects sector characteristics.
Selected sector adoption
U.S. sector rates; not NJ-specific sector estimates. [S2][S4]
NY & Northern NJ regional trend
ServicesManufacturing
Regional NY/Northern NJ series - not a statewide New Jersey estimate. [S5]
2.4 Regional acceleration
Northern New Jersey's regional signal is much faster
In August 2026, 61% of service firms and 51% of manufacturers in the New York-Northern New Jersey regional business surveys reported using AI as part of business processes in the prior six months. Services rose from 25% in 2024 to 61% in 2026; manufacturing rose from 16% to 51%. [S5]
These figures are valuable for trend and sector context, but they should not be relabeled as statewide New Jersey rates. The denominator is regional and the question differs from Census BTOS.
2.5 Adoption depth & security concern
Widespread adoption does not necessarily mean deep operational dependence
The same New York Fed research reports median worker penetration of only 17% in adopting service firms and 7% in manufacturing. About three-quarters of service firms and more than 90% of manufacturers characterized AI investment as minimal or modest. [S5]
In the Third District small-business evidence, 25% of current AI users cited data security/privacy as a challenge, while 14% of nonadopters cited it as a reason not to adopt. Those values come from different question populations and should not be subtracted into an artificial "gap." [S6]
25%of Third District AI users cited data security/privacy as a challengeRegional small-business evidence, not a NJ-only statewide estimate. [S6]
Chapter 3
Security, Governance & Threat Analysis
New Jersey's cyber pressure is substantial. The correct security benchmark must measure foundational controls at the organization level rather than infer them from incident counts.
Pages 19-30 · controls, incidents, credentials and loss

Threat evidence answers a different question from governance evidence. NJCCIC, FBI and breach reporting can show that the security environment is high pressure. They cannot, by themselves, tell us what share of AI-adopting New Jersey businesses has complete MFA, controlled data paths, tested recovery or approved AI governance.
The chapter therefore uses public security data to establish consequence and operating context, then defines the controls that a matched benchmark should actually measure.
3.1 Incident pressure
Incident reporting rose sharply in 2025
NJCCIC received 954 cybersecurity incident reports in 2025, up 92% from 2024. Social engineering was the largest reported category, followed by unauthorized access/hacking and ransomware. [S8]
Incident reports are not a census of attacks against New Jersey businesses. Reporting behavior, classification and awareness all affect the count. Their role here is to establish that organizations are operating in a materially active threat environment.
954NJCCIC incident reports2025 · +92% year over year [S8]
Compromised-credential notifications
NJCCIC credential notifications. [S8]
3.2 Identity exposure
Credential exposure is a rapidly worsening New Jersey signal
NJCCIC issued 94,168 compromised-credential notifications in 2025, up from 28,145 in 2024 - a 234.6% increase, consistent with the agency's rounded +235% statement. [S8]
For AI governance, identity matters twice: employees authenticate to AI applications, and agents/services may introduce non-human identities, API keys, service accounts and delegated permissions. That is why a binary "MFA enabled" field is not enough; complete eligible-account coverage and privileged/NHI treatment are stronger measures.
3.3 Breach composition
Ransomware and unauthorized access dominate reported breach causes
NJCCIC received 1,951 initial breach reports affecting New Jersey residents in 2025. Ransomware accounted for 813 reports (42%), unauthorized access 676 (35%), social engineering 311 (16%), accidental exposure 92 (5%), insider theft 48 (2%), with a small remainder across other/device-media causes. [S8]
A breach report is not a New Jersey business, and one organization can appear more than once. The value of this evidence is consequence context and control prioritization.
1,951reports
Ransomware 42%Unauthorized access 35%Social engineering 16%Accidental exposure 5%Insider theft 2%
New Jersey IC3 reported losses
20,648 complaints$31,984 loss / complaint (derived)
IC3 complaints include individuals and organizations; the derived quotient is not an average business breach cost. [S9][S10]
3.4 Financial consequence
Reported cybercrime losses reached $660.4M in 2025
FBI IC3 received 20,648 New Jersey complaints in 2025 with $660.4 million in reported losses, placing the state fifth by reported complaint loss. The 2024 loss total was $434.9 million. [S9][S10]
This is strong evidence that cyber-enabled crime touching New Jersey has material financial scale. It is not a business-loss average and should not be presented as one.
3.5 Minimum governance standard
A defensible benchmark needs observable pass rules
NIST CSF 2.0 provides the cross-sector structure, while AI-specific guidance adds questions around approved tools, shadow AI, connectors, models, agents and sensitive data. The study should measure controls that can be observed consistently across organizations rather than vague claims of "AI security maturity." [S11][S12][S13]
Approved AI policyPermitted use, data classes and accountability.
Complete MFAEligible human and privileged identities covered.
Data protectionDLP / sensitivity controls for in-scope users and workloads.
Approved AI pathManaged/private/enterprise tool inventory where needed.
Vendor reviewDocumented third-party risk and data terms.
Verified recoveryBackup coverage plus tested restore evidence.
Chapter 4
New Jersey Regulation & Sector Implications
New Jersey law, regulatory examinations and enforcement make AI governance a concrete control question in financial services, healthcare, life sciences and professional services.
Pages 31-37 · regulation, privacy and sector stakes
Regulation does not prove that New Jersey organizations are insecure. It does show that AI use, sensitive data and cybersecurity are increasingly being examined together. That matters because the matched-study design is not inventing an artificial relationship between AI and controls; at least one New Jersey regulator is already asking firms about both in the same supervisory process. [S19]
Regulation-to-governance map
Sector pressure flows into a measurable control stack
01NJ privacy lawData minimization · safeguards · sensitive data
02Financial services examsAI use · policies · training · vendor diligence
03Healthcare / life sciencesIdentity failures · monitoring gaps · recovery consequences
04Third-party ecosystemConnectors · processors · external AI tools
What the benchmark should test
Common organization-level governance lens
- Does the organization use AI?
- Are minimum controls present?
- Can those controls be measured consistently?
Approved AI tools
MFA & identity discipline
Data-path rules
Vendor review
Logging & monitoring
Backup & recovery
4.1 Financial services
Nearly 800 investment adviser firms face a joint AI + cybersecurity examination focus
In June 2026, the New Jersey Bureau of Securities announced that its annual examination of nearly 800 NJ-registered investment adviser firms would focus on protecting sensitive data and emerging AI risks. The examination seeks information about AI use and cybersecurity practices including written policies and procedures, periodic employee training and ongoing third-party vendor cybersecurity due diligence. [S19]
The questionnaire shows that AI and cybersecurity are jointly material supervisory topics. It does not reveal how many firms passed or failed each control because response results are not public.
~800NJ investment adviser firms2026 examination focus: AI use + cybersecurity + sensitive data [S19]
Data minimizationAsk whether AI use has defined data-purpose and minimization rules.
Reasonable safeguardsMeasure actual administrative, technical and physical coverage.
Confidentiality / integrity / accessibilityTrace AI data paths, storage, connectors and downstream handling.
Sensitive dataIdentify whether sensitive data are permitted in AI workflows and on what basis.
Heightened-risk processingCapture whether relevant AI processing is assessed before deployment.
4.2 Privacy law
New Jersey privacy law turns data governance into a measurable control question
New Jersey's privacy regime requires reasonable administrative, technical and physical data-security practices appropriate to the volume and nature of personal data. P.L. 2026, c.25 amended the regime while retaining these duties and clarifying sensitive-data treatment. [S20][S21]
The research uses the law to identify measurable governance dimensions, not to provide legal advice. Whether a specific organization or use case is covered requires fact-specific legal analysis.
4.3 Healthcare & life sciences
Identity basics can fail catastrophically in sensitive-data environments
The New Jersey Attorney General's Enzo Biochem settlement followed a 2023 ransomware breach affecting approximately 2.4 million patients nationwide, including about 331,600 New Jersey residents. The agreement required stronger controls and a $4.5 million payment. [S22]
The case materials describe shared and long-lived credentials, inadequate monitoring and remedial requirements including MFA, encryption, risk assessment and incident response. These are foundational controls that should be tested alongside AI adoption rather than replaced by AI-specific policy questions.
2.4Mpatients nationwide~331,600NJ residents$4.5MsettlementMFArequired remedial control
48%of breaches involved third partiesVerizon 2026 DBIR external benchmark - context, not NJ prevalence. [S14]
4.4 Third-party risk
AI vendors and connectors expand the security boundary
The Morgan Stanley settlement cited in the report involved data-security incidents affecting more than 3.37 million individuals nationwide, including 755,592 New Jersey residents, and centered on data disposal and vendor-management failures. [S23]
AI introduces vendors, connectors and data processors into the same boundary. A mature governance study should therefore capture approved vendor status, allowed data classes, connector scope, review date, contractual data terms and incident-notification provisions.
4.5 Sector implication
High adoption does not imply weak security - which is why sector matching matters
Finance combines high national AI adoption with explicit supervisory scrutiny. Healthcare and life sciences combine sensitive data with significant consequence if identity, data-protection or recovery controls fail. Legal and professional services combine knowledge-work utility with confidentiality stakes. The benchmark therefore needs sector and company-size cohorts rather than one undifferentiated statewide score.
Chapter 5
Synthesis, Answer & Original Contribution
The adoption trajectory is visible. The comparable statewide control-maturity trajectory is not. That missing join is the central research white space.
Pages 38-43 · proof matrix, null findings, prior art, red team
The strongest answer to the research question is a measured "not yet proven," not a weak result. AI adoption is established and uneven; high-adoption pockets are substantial. Cyber incidents, credential exposure and reported losses in New Jersey are material. Security/privacy is a reported adoption challenge for some regional small businesses. State regulators are already asking firms about AI and cybersecurity together. [S4][S6][S8][S9][S19]
What is missing is a comparable organization-level denominator showing whether AI adopters have complete governance controls. That missing measurement is itself publishable white space.
Evidence boundary
What we can say now — and what still requires a matched benchmark
Observed statewide
AI adoption is real
State, size and sector evidence support material AI use.
Observed statewide
Cyber pressure is material
Incidents, credential exposure, breaches, loss and enforcement all register.
Observed regionally
Security/privacy can constrain adoption
Regional survey evidence shows friction, but not a statewide pass/fail score.
Still unknown
Do NJ AI adopters lack minimum controls?
No public organization-level denominator yet connects adoption to the same control set.
Publication-safe conclusion
AI adoption is expanding into a high-pressure cyber environment, but the control-maturity gap is not yet proven statewide.
PropositionEvidence todayStatus
NJ businesses use AI at material scale18.5% current; 20.5% plannedSupported
Adoption concentrates in larger / knowledge sectorsCensus + NY Fed patternsSupported
Cyber pressure on NJ organizations is materialNJCCIC incidents, breaches, credentials; FBI lossesSupported
Security/privacy constrains some AI adoptionThird District + NY Fed regional surveysSupported regionally
NJ AI adopters lack adequate controlsNo matched public denominatorUnknown
AI adoption causes more NJ breachesNo causal designNot established
Security controls reduce AI-related loss in NJNo NJ causal estimateUnknown
5.1 Null findings
A credible study has to allow results that weaken the hypothesis
Regional AI use can be broad at the organization level while shallow inside the workforce: median worker penetration among adopting service firms was 17% and manufacturing 7%. Most regional adopters described AI investment as minimal or modest, and AI-related layoffs remained uncommon in the cited survey. [S5]
Third District AI users report data security/privacy as a challenge, but 28% reported no AI-related challenges at all. High adoption in finance and knowledge sectors also does not demonstrate weaker security; regulation may push in the opposite direction. [S6][S19]
Shallow workforce penetrationBroad firm-level adoption can still touch a minority of workers.
Modest investmentExperimentation and partial deployment remain common.
Disconfirming evidence allowedThe conclusion must change if controls keep pace.
Census BTOSState/sector/size adoption
NY / Philly FedRegional adoption, workforce, challenges
Rutgers / HeldrichNJ small-business needs and context
NJCCIC / FBIThreats, incidents and reported loss
NIST / vendor researchControl frameworks and benchmarks
5.2 Original contribution
Originality comes from the join, not from claiming nobody has studied AI adoption
New Jersey AI research already exists. The open research space is a quantitative, organization-level benchmark joining AI use to controls such as MFA coverage, DLP, vendor governance, patch latency, monitoring and tested recovery. [S25][S26]
The proposed contribution is a privacy-preserving panel of New Jersey employer organizations assessed within a common observation window, with adopter/nonadopter comparisons and sector/size cohorts where sample size permits.
5.3 Headline gate
The future media result should not exist until the real numerator and denominator are calculated
A defensible future headline might state that "X% of AI-adopting New Jersey businesses in the assessed sample lacked at least one minimum governance control." The X should not be created until the actual matched data exist. That discipline is the difference between a research finding and a marketing claim.
Chapter 6
Methodology & Matched Study Design
The next-stage empirical test should be reproducible, privacy-preserving, denominator-explicit and simple enough to survive red-team scrutiny.
Pages 44-49 · study design, data dictionary, publication package
The proposed unit of analysis is the employer organization or tenant. Account, device, workload and incident records roll up to that organization so the study can answer one primary question: among assessed New Jersey employer organizations, what share of current AI adopters lacks the predefined minimum control set?
The preferred primary outcome is the Governed AI Adoption Rate, with the Governance Gap Rate defined as its complement. Each control component should also be published separately so the composite cannot hide the mechanism.
6.1 Seven-step pipeline
Use the simplest defensible method
A transparent cross-tab with correct denominators is better than an unstable multivariable model on a small convenience sample. The pipeline therefore moves from adoption benchmark to control pass rate, matched comparison, subgroup analysis, incident normalization, transparent publication and fixed-cadence repetition.
1Benchmark adoptionExternal NJ baseline
2Measure control pass ratesSame organizations
3Compare adopters / nonadoptersNo causal overclaim
4Test size / sector gapsStratify cohorts
5Normalize incidentsUser- or org-months
6Publish denominatorsInclude missingness
7RepeatFixed cadence
6.2 Operational workstreams
Adoption and controls must share the same observation window
The proposed matched study combines operational and survey evidence across seven workstreams. The point is not to maximize the number of fields; it is to ensure that every numerator has a denominator and that each control can be traced back to an organization in the same cohort.
Privacy by design is built in: no raw prompts, message content, customer documents, usernames, patient/client data or other personally identifiable content is required for this research question. Stable randomized organization IDs and aggregated control counts are sufficient.
AdoptionCurrent use + intensity
IdentityComplete MFA + privileged/NHI
DataControlled data-path rate
EndpointExposure / patch lag
RecoveryProven restore rate
GovernancePolicy / training / review
IncidentsNormalized context

6.3 Red-team confounders
A security gap can be manufactured statistically if the study ignores who adopts AI
Larger firms adopt more AI and may also have stronger controls. Finance and healthcare may have both higher adoption and stronger regulatory requirements. Blueclone-managed clients may be more security-mature than the state average. Missing telemetry can look like a failed control if unknown and absent are not separated.
Firm sizeStratify / adjust
IndustryMatched cohorts
Managed IT selectionDescribe sample explicitly
Observation coverageUnknown ≠ absent
Tool intensityMeasure adoption depth
Security investmentMeasure baseline maturity
Reporting propensityNormalize cautiously
Time alignmentCommon windows
6.4 Statistical treatment
Publish uncertainty, denominators and meaningful effect sizes
Survey-derived proportions should report weighted estimate, unweighted N where available, denominator definition and confidence interval consistent with the survey design. Blueclone telemetry should report exact organization counts and percentages without statewide weighting unless the sample design supports it. Unknown controls should be handled with sensitivity analysis rather than silently recoded as failures.
A statistically detectable difference is not automatically operationally meaningful. Publish absolute percentage-point differences, denominators and confidence intervals alongside p-values or model estimates where used.
Chapter 7
Sources, Evidence Ledger & Research Trace
The report's credibility depends on knowing which claims are observed, derived, inferred, hypothetical or unknown - and being able to trace each material claim back to a source.
Pages 50-56 · source ledger, evidence ledger, limitations and team
The source architecture deliberately separates evidence types. Government primary sources anchor state adoption, cyber incidents, reported loss, regulation and enforcement. Federal Reserve research provides regional adoption, workforce and challenge context. NIST provides control frameworks. Vendor studies are used as external benchmarks, not as estimates of New Jersey prevalence. Company and Clutch materials are used for leadership/entity context only.
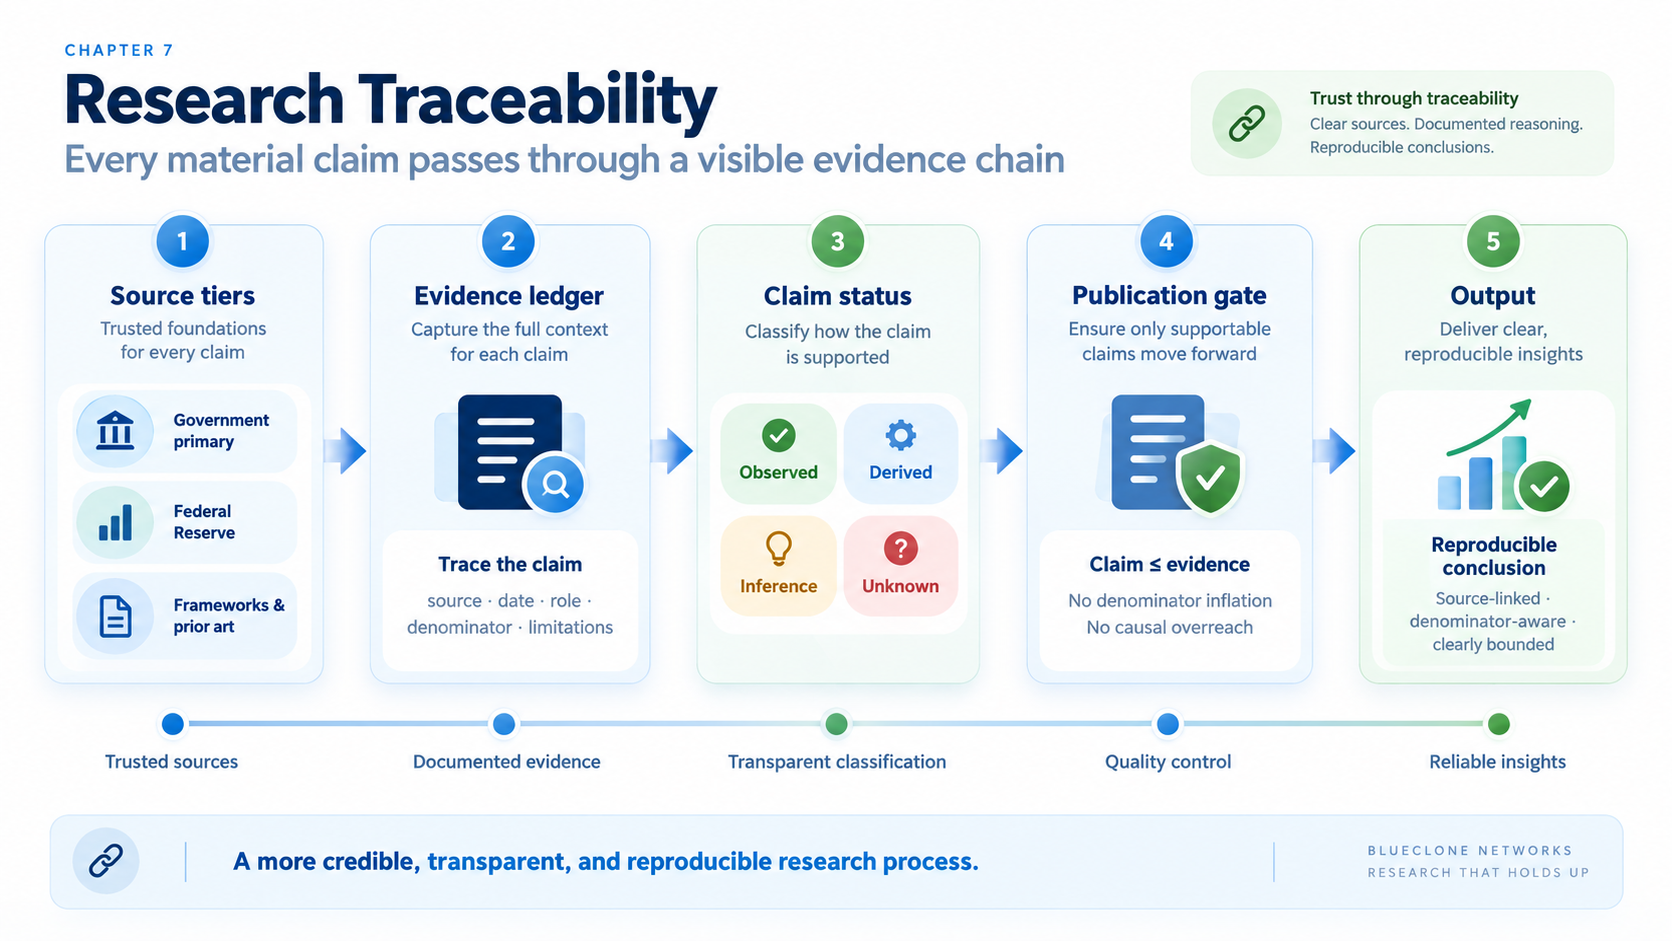
ObservedDirectly reported by the source.
DerivedArithmetic from sourced values.
InferenceInterpretation clearly separated from observation.
UnknownEvidence insufficient; no value invented.
7.1 Research boundary
Some tempting claims were deliberately rejected
The report does not blend old and new Census AI question series without warning; it does not convert global vendor breach statistics into New Jersey prevalence; it does not treat incident or breach reports as counts of unique New Jersey businesses; and it does not invent a statewide AI governance-gap percentage.
Those exclusions are part of the evidence ledger, not missing analysis. They preserve the distinction between what the current public evidence can support and what requires the proposed matched study.
Direct source references
S1
Business Trends and Outlook Survey Data Release - May 7, 2026U.S. Census Bureau
↗S2Large Firms With at Least 20 Employees Biggest AI UsersU.S. Census Bureau
↗S3BTOS AI Supplement QuestionnaireU.S. Census Bureau
↗S4Big Companies Are Racing Ahead on AI - but Few Are Cutting JobsLendingTree / Census analysis
↗S5Businesses Are Using AI to Transform Work, Not Cut JobsFederal Reserve Bank of New York
↗S6Small Business Credit Survey: 2026 Insights into the Third District RegionFederal Reserve Bank of Philadelphia
↗S7QuickFacts: New JerseyU.S. Census Bureau
↗S82026 New Jersey Statewide Threat AssessmentNJ OHSP / NJCCIC
↗S92025 IC3 Annual ReportFBI
↗S102024 IC3 Annual ReportFBI
↗S11Cybersecurity Framework 2.0NIST
↗S12Cybersecurity Framework Profile for Artificial IntelligenceNIST
↗S13AI Risk Management Framework: Generative AI ProfileNIST
↗S142026 Data Breach Investigations ReportVerizon
↗S15State of Identity Security 2026Sophos
↗S16State of Ransomware 2026Sophos
↗S17Cost of a Data Breach Report 2026IBM / Ponemon
↗S18Cost of a Data Breach Report 2025IBM / Ponemon
↗S19NJ Bureau of Securities 2026 Investment Adviser ExaminationNJ Office of Attorney General
↗S20P.L. 2023, c.266New Jersey Legislature
↗S21P.L. 2026, c.25New Jersey Legislature
↗S22Enzo Biochem multistate data-security settlementNJ Office of Attorney General
↗S23Morgan Stanley data-security settlementNJ Office of Attorney General
↗S24Weichert cybersecurity settlementNJ Office of Attorney General
↗S25An Examination of Artificial Intelligence and Small Businesses in New JerseyNJ State Policy Lab / Rutgers
↗S26The Voices of Small Business Owners in Middlesex CountyNJ State Policy Lab / Heldrich
↗S27CEO Message / company backgroundBlueclone Networks
↗S28Blueclone Networks profileClutch
↗Frequently Asked Questions
FAQ: New Jersey AI Adoption, Security & Governance
Twelve evidence-grounded answers to the most important questions raised by the research.
These FAQs summarize the report's findings without expanding the claim beyond the evidence. Where the public data cannot support a statewide conclusion, the answer says so explicitly.
After Chapter 7 · before Full Research Appendix
1. What percentage of New Jersey businesses are currently using AI?
The best public state benchmark used in this research is 18.5% current AI use in May 2026, with 20.5% expecting to use AI in the next six months. The report attributes those New Jersey cells to a published LendingTree extraction of official Census BTOS data and keeps that provenance visible rather than presenting the state cell as a direct machine extraction.
Sources: S1 · S42. Does the research prove that AI adoption is already outrunning security in New Jersey businesses?
No. The report finds material AI adoption and substantial cyber pressure, but no public statewide dataset measures AI adoption and security-control maturity in the same New Jersey businesses. The publication-safe conclusion is that the hypothesis is serious and measurable, but not yet proven statewide.
Sources: S4 · S8 · S9 · S193. Why is the 61% regional service-firm AI figure not a statewide New Jersey estimate?
The 61% figure comes from New York Federal Reserve regional business surveys covering New York and Northern New Jersey. It uses a different population, geography, timing and question from the statewide Census benchmark. The report uses it as regional trend and sector context, not as a replacement for the 18.5% New Jersey state estimate.
Source: S54. What cybersecurity pressure signals does the report identify in New Jersey?
NJCCIC received 954 cyber incident reports in 2025, up 92% from 2024, and issued 94,168 compromised-credential notifications, up 235%. FBI IC3 separately recorded 20,648 New Jersey complaints and $660.4 million in reported losses in 2025. These figures describe the threat environment; they are not a direct measure of control maturity among AI adopters.
Sources: S8 · S95. Does 94,168 compromised-credential notifications mean 94,168 New Jersey businesses were hacked?
No. A compromised-credential notification is not the same thing as a unique business, person or cyber incident. One organization may receive multiple notifications, and the metric does not show whether the affected organization uses AI. The report therefore treats the figure as an identity-risk signal, not a business-prevalence denominator.
Source: S86. Which security and governance controls should be measured alongside AI adoption?
The proposed benchmark includes approved AI use and policy, complete eligible-account MFA coverage, controlled data paths and DLP coverage, vendor review, patch and endpoint maturity, monitoring, and tested backup/recovery. The point is to use observable pass rules rather than broad labels such as “secure” or “compliant.”
Sources: S11 · S12 · Chapter 6 methodology7. How does New Jersey privacy law relate to AI governance?
The report uses New Jersey privacy requirements to identify measurable governance dimensions such as data minimization, reasonable administrative/technical/physical safeguards, sensitive-data handling and control of data paths. It does not provide legal advice or claim that every AI use case is covered by the same statutory provisions.
Sources: S20 · S218. Why is financial services an important cohort for the proposed benchmark?
Finance and insurance are among the higher-adoption sectors in the national Census evidence, and New Jersey regulators are already asking nearly 800 registered investment adviser firms about AI use, cybersecurity practices, sensitive data, employee training and vendor due diligence. That makes finance a strong sector for matched adoption-and-control measurement.
Sources: S2 · S199. Why does the report discuss healthcare and life sciences?
Healthcare and life-sciences organizations can combine sensitive data, identity complexity and high consequence if controls fail. The Enzo Biochem enforcement example shows the importance of foundational safeguards such as MFA, encryption, monitoring and incident response. The report does not infer that New Jersey healthcare AI adopters are less secure than other sectors.
Source: S2210. Why is third-party risk part of the AI security boundary?
AI adoption increasingly introduces vendors, connectors, service accounts, data processors and delegated access into business workflows. The report therefore treats vendor review, allowed data classes, connector scope, contractual data terms and incident-notification provisions as part of the measurable governance boundary.
Sources: S14 · S2311. What is the proposed matched New Jersey study?
The proposed study would observe AI use and minimum governance controls in the same employer organizations during the same observation window. It would compare adopters and nonadopters, publish explicit numerators and denominators, separate unknown from absent controls, and use privacy-preserving organization IDs rather than collecting raw prompts or customer content.
Chapter 6 methodology12. What findings would weaken or reject the “outpacing” hypothesis?
If AI adopters have equal or stronger complete-control coverage than comparable nonadopters after adjusting for company size and industry, or if apparent gaps disappear under reasonable missing-data treatments, the hypothesis should be weakened or rejected. The methodology is intentionally designed to allow that outcome.
Chapter 6 red-team analysis1. What percentage of New Jersey businesses are currently using AI?
The best public state benchmark used in this research is 18.5% current AI use in May 2026, with 20.5% expecting to use AI in the next six months. The report attributes those New Jersey cells to a published LendingTree extraction of official Census BTOS data and keeps that provenance visible rather than presenting the state cell as a direct machine extraction. Sources: S1 · S4
2. Does the research prove that AI adoption is already outrunning security in New Jersey businesses?
No. The report finds material AI adoption and substantial cyber pressure, but no public statewide dataset measures AI adoption and security-control maturity in the same New Jersey businesses. The publication-safe conclusion is that the hypothesis is serious and measurable, but not yet proven statewide. Sources: S4 · S8 · S9 · S19
3. Why is the 61% regional service-firm AI figure not a statewide New Jersey estimate?
The 61% figure comes from New York Federal Reserve regional business surveys covering New York and Northern New Jersey. It uses a different population, geography, timing and question from the statewide Census benchmark. The report uses it as regional trend and sector context, not as a replacement for the 18.5% New Jersey state estimate. Source: S5
4. What cybersecurity pressure signals does the report identify in New Jersey?
NJCCIC received 954 cyber incident reports in 2025, up 92% from 2024, and issued 94,168 compromised-credential notifications, up 235%. FBI IC3 separately recorded 20,648 New Jersey complaints and $660.4 million in reported losses in 2025. These figures describe the threat environment; they are not a direct measure of control maturity among AI adopters. Sources: S8 · S9
5. Does 94,168 compromised-credential notifications mean 94,168 New Jersey businesses were hacked?
No. A compromised-credential notification is not the same thing as a unique business, person or cyber incident. One organization may receive multiple notifications, and the metric does not show whether the affected organization uses AI. The report therefore treats the figure as an identity-risk signal, not a business-prevalence denominator. Source: S8
6. Which security and governance controls should be measured alongside AI adoption?
The proposed benchmark includes approved AI use and policy, complete eligible-account MFA coverage, controlled data paths and DLP coverage, vendor review, patch and endpoint maturity, monitoring, and tested backup/recovery. The point is to use observable pass rules rather than broad labels such as “secure” or “compliant.” Sources: S11 · S12 · Chapter 6 methodology
7. How does New Jersey privacy law relate to AI governance?
The report uses New Jersey privacy requirements to identify measurable governance dimensions such as data minimization, reasonable administrative/technical/physical safeguards, sensitive-data handling and control of data paths. It does not provide legal advice or claim that every AI use case is covered by the same statutory provisions. Sources: S20 · S21
8. Why is financial services an important cohort for the proposed benchmark?
Finance and insurance are among the higher-adoption sectors in the national Census evidence, and New Jersey regulators are already asking nearly 800 registered investment adviser firms about AI use, cybersecurity practices, sensitive data, employee training and vendor due diligence. That makes finance a strong sector for matched adoption-and-control measurement. Sources: S2 · S19
9. Why does the report discuss healthcare and life sciences?
Healthcare and life-sciences organizations can combine sensitive data, identity complexity and high consequence if controls fail. The Enzo Biochem enforcement example shows the importance of foundational safeguards such as MFA, encryption, monitoring and incident response. The report does not infer that New Jersey healthcare AI adopters are less secure than other sectors. Source: S22
10. Why is third-party risk part of the AI security boundary?
AI adoption increasingly introduces vendors, connectors, service accounts, data processors and delegated access into business workflows. The report therefore treats vendor review, allowed data classes, connector scope, contractual data terms and incident-notification provisions as part of the measurable governance boundary. Sources: S14 · S23
11. What is the proposed matched New Jersey study?
The proposed study would observe AI use and minimum governance controls in the same employer organizations during the same observation window. It would compare adopters and nonadopters, publish explicit numerators and denominators, separate unknown from absent controls, and use privacy-preserving organization IDs rather than collecting raw prompts or customer content. Chapter 6 methodology
12. What findings would weaken or reject the “outpacing” hypothesis?
If AI adopters have equal or stronger complete-control coverage than comparable nonadopters after adjusting for company size and industry, or if apparent gaps disappear under reasonable missing-data treatments, the hypothesis should be weakened or rejected. The methodology is intentionally designed to allow that outcome. Chapter 6 red-team analysis
Full Research Appendix
All 56 source pages, searchable
This appendix preserves the full research text page by page. It is supporting evidence, not the primary visual reading experience.
All source content retained
Chapter 1 · Executive Findings & Evidence Model
01Is AI Adoption Outrunning Security in New Jersey Businesses?Chapter 1 · source page 1+
BLUECLONE RESEARCH · NEW JERSEY

  Is AI Adoption Outrunning Security
  in New Jersey Businesses?
  A 2025–2026 evidence synthesis of business AI adoption, cybersecurity incidents, breach
  exposure, regulatory expectations, and the missing governance benchmark

  18.5%                                       954                                   1,951                                    $660.4M
  NJ businesses using AI                      NJCCIC incident reports               NJ breach reports                        NJ IC3 reported losses
  Secondary extraction of Census              2025 · +92% vs 2024                   2025 · affecting NJ residents            2025 · 5th-highest state total
  BTOS, May 2026

  EVIDENCE-PROPORTIONAL CONCLUSION
  CORE FINDING
  AI adoption is materially present and accelerating in important New Jersey business segments while cyber incidents,
  credential exposure, reported losses, and regulatory scrutiny are simultaneously high. However, no public statewide
  dataset measures AI adoption and security-control maturity in the same New Jersey businesses. The defensible conclusion
  is a rising exposure surface plus a measurable governance-data gap—not a fabricated statewide “AI security gap”
  percentage.

Evidence summary. Census-based state data place New Jersey business AI use at 18.5% in the May 2026 release, while
regional Federal Reserve surveys show much higher use in service, manufacturing, and knowledge-intensive firms.
NJCCIC, FBI IC3, and state enforcement evidence show substantial cyber pressure. Security/privacy already appears as
an AI adoption concern in regional small-business evidence. These datasets are complementary, not interchangeable:
none alone proves that the same AI-using NJ firms lack adequate controls. [S1][S4][S5][S6][S8][S9]

 Research period                       Evidence refresh             Research lead                    Target audience                 Status

                                                                                                     NJ businesses · journalists ·   Public-evidence full
                                                                    Milan Baria · Founder &
 2024–Sep 2026                         Sep. 21, 2026                                                 analysts · regulators ·         research · matched-control
                                                                    CEO, Blueclone Networks
                                                                                                     IT/security leaders             study proposed

Sources: S1 · S4 · S5 · S6 · S8 · S9
02Research leadership & report mapChapter 1 · source page 2+
Research leadership & report map
The report opens with evidence, not marketing; full source and leadership notes appear at the end.

  RESEARCH LEADERSHIP
  Milan Baria · Founder & CEO, Blueclone Networks
  Blueclone’s company materials identify Milan Baria as founder and CEO and describe prior enterprise IT work in
  pharmaceutical and healthcare environments before founding the company in 2006. A current Clutch profile
  independently verifies Blueclone Networks, LLC as an active New Jersey business formed in 2006 and shows a Premier
  Verified profile with 10 verified reviews. These credentials provide industry context; they are not evidence for the
  statistical findings in this report. [S27][S28]

 Pages                                    Section                                        Purpose

                                          Executive findings, evidence model, NJ
 3–8                                                                                     Define the problem and denominators.
                                          business landscape

                                                                                         State, national, size, sector and regional
 9–18                                     AI adoption analysis
                                                                                         evidence.

                                                                                         Controls, incidents, credentials, cybercrime
 19–30                                    Security, governance and threat analysis
                                                                                         and global benchmarks.

                                          New Jersey regulation and sector               Financial services, privacy law,
 31–37
                                          implications                                   enforcement, healthcare, legal/professional.

                                          Synthesis, answer, null findings, prior art,   Separate what is observed from what
 38–43
                                          red-team                                       remains unknown.

                                          Methodology, matched study, data
 44–49                                                                                   Make the next test reproducible.
                                          dictionary, publication package

                                          Source ledger, evidence ledger, research
 50–55                                                                                   Trace every material claim.
                                          trace, limitations, team

  Research principle
  Make the claim no larger than the evidence—and make the methodology clear enough for another analyst to reproduce it.

Sources: S27 · S28 · S31
03Executive findingsChapter 1 · source page 3+
Executive findings
The evidence supports a serious security-readiness question, but not a statewide causal verdict.
18.5% 20.5% 25% 94,168
NJ current AI use NJ expected AI use AI-using Third District firms NJCCIC credential
May 2026 Census-based state Next six months [S4]
citing data security/privacy notifications
extraction [S4] Regional small-business sample; not 2025; +235% year over year [S8]
NJ-only [S6]
FACT — Census BTOS provides state, industry and firm-size AI adoption estimates; its sample framework is approximately
1.2 million employer businesses divided across six panels, not 1.2 million completed AI responses. [S1]
OBSERVED — A published extraction of the official May 2026 BTOS release reports 18.5% of New Jersey businesses using
AI in the prior two weeks and 20.5% expecting to use it in the next six months. [S4]
OBSERVED — New York Fed regional surveys covering New York and Northern New Jersey show 61% AI use among
service firms and 51% among manufacturers in 2026, up sharply from 2024. [S5]
OBSERVED — NJCCIC received 954 cyber incident reports in 2025, up 92%, and issued 94,168 compromised-credential
notifications, up 235%. [S8]
OBSERVED — FBI IC3 received 20,648 New Jersey complaints in 2025 with $660.4 million in reported losses; the loss total
ranked fifth among states. [S9]
UNKNOWN — No public dataset reviewed provides a matched NJ business denominator for approved AI policy, complete
MFA coverage, DLP, managed/private AI, tested recovery, patch latency, and incident monitoring among the same AI
adopters.
Bottom line
New Jersey has crossed the threshold where AI governance and cyber controls should be measured together. The evidence
supports urgency and a matched-control research program; it does not support claiming that a specific share of NJ AI
adopters is insecure without new organization-level data.
Sources: S1 · S4 · S5 · S6 · S8 · S9
04Research summary dataChapter 1 · source page 4+
Research summary data
Each dataset answers a different part of the research question.

 Evidence layer                         Dataset / scale             Unit / denominator          Role                         Key limitation

                                                                                                                             Exact NJ cell used here is
                                        Census BTOS · ~1.2M-        Weighted employer
                                                                                                State/sector/size adoption   from a published
 Adoption                               business sample             businesses responding to
                                                                                                benchmark                    secondary extraction of
                                        framework                   each question
                                                                                                                             Census data.

                                                                    Regional businesses in NY   Trend and sector             Not a New Jersey-only
 Regional adoption                      NY Fed business surveys
                                                                    & Northern NJ               concentration                estimate.

                                        Fed SBCS · 894 Third        Weighted firms; AI module   AI use + adoption            AI module not state-
 Small-business adoption
                                        District small employers    regional                    challenges                   specific at publication.

                                                                                                                             Voluntary/operational
                                                                    Reported cybersecurity
 NJ incidents                           NJCCIC 2025 · 954 reports                               Threat environment           reporting; not incidence
                                                                    incidents
                                                                                                                             census.

                                                                                                                             Organizations may be
                                        NJCCIC · 1,951 initial      Data breach reports                                      outside NJ; affected
 NJ breach notices                                                                              Consequence surface
                                        reports                     affecting NJ residents                                   residents are not business
                                                                                                                             denominators.

                                                                                                                             Individuals and
                                        FBI IC3 · 20,648 NJ         Complaints with state                                    organizations;
 Cybercrime                                                                                     Reported loss context
                                        complaints                  information                                              underreporting; not
                                                                                                                             business-only.

                                                                    Frameworks, incidents,
                                        NIST / Verizon / Sophos /                               Control priorities and       Different populations; no
 Control context                                                    surveys, breached
                                        IBM                                                     external benchmarks          direct NJ prevalence.
                                                                    organizations

  Scale discipline
  The report never treats survey sample frames, completed responses, businesses represented, cyber events, breach notices,
  user accounts, or affected people as interchangeable. Cross-dataset comparisons are descriptive unless a common
  denominator exists.

Sources: S1 · S5 · S6 · S8 · S9 · S11 · S14 · S15 · S16 · S17
05Evidence model & claim disciplineChapter 1 · source page 5+
Evidence model & claim discipline
Five labels are used to prevent hypotheses from becoming headlines.
Label Meaning Example in this report
Directly supported by authoritative BTOS publishes AI adoption by state,
FACT
documentation. industry and firm size. [S1]
Directly reported in a cited NJCCIC received 954 incident reports in
OBSERVED
dataset/publication. 2025. [S8]
Arithmetic calculated from sourced NJ IC3 complaints rose 31.5% from 2024
DERIVED
figures. to 2025. [S9][S10]
Higher AI use in information/finance
Evidence-grounded interpretation, not
INFERENCE makes governance measurement
directly measured.
especially consequential.
AI adopters are less likely than needed to
HYPOTHESIS A proposition requiring matched data.
have complete control coverage.
Statewide share of NJ AI adopters with
UNKNOWN Evidence is insufficient. approved AI policy + complete MFA +
DLP.
The central discipline
A 20% AI-adoption rate minus a 15% security-control rate from a different sample does not equal a 5-point governance
gap. The study therefore refuses to manufacture a single “gap” statistic from unmatched datasets.
No correlation is presented as causation.
Industry surveys remain labeled by vendor, geography, and respondent population.
Global breach-cost means are not localized to a typical NJ SMB.
State incident counts are not used as business-prevalence estimates.
AI adoption before and after the November 2025 Census question change is not plotted as a continuous series.
Sources: S1 · S2 · S31
06What would “AI adoption outrunning security” actuallyChapter 1 · source page 6+
What would “AI adoption outrunning security” actually
mean?
The phrase requires matched measurement, not rhetorical juxtaposition.

A defensible test requires observing AI adoption and required controls within the same organization cohort, ideally at
the same time. The core unit of analysis should be an employer organization or tenant—not an incident, user account,
device, breach notification, or employee.

 Construct                                                 Operational measure                            Preferred denominator

                                                           Current business use of AI in any business
 AI adoption                                                                                              Employer organizations assessed
                                                           function

                                                           Approved policy, approved-tool inventory,
 AI governance                                                                                            AI-adopting organizations assessed
                                                           data rules, vendor review, output review

                                                           Eligible identities protected by required
                                                                                                          Eligible accounts + organization-level
 Identity security                                         MFA; privileged/NHI controls; risky-login
                                                                                                          completeness
                                                           monitoring

                                                           DLP/sensitivity coverage and controlled path   In-scope users/workloads + organization-
 Data protection
                                                           for sensitive data                             level completeness

 Endpoint / patch                                          Critical patch latency, lifecycle exposure     Managed endpoints / critical findings

                                                           Backup coverage + verified restore test
 Recovery                                                                                                 In-scope workloads + organizations
                                                           within policy window

  PROPOSED DERIVED METRIC
  Preferred primary metric
  Governed AI Adoption Rate = AI adopters meeting all defined minimum controls ÷ AI adopters assessed. Governance Gap
  Rate = 1 − Governed AI Adoption Rate. The numerator and denominator must be published together.

Sources: Method specification: S31 · control rationale: S11 · S12 · S14 · S15
07New Jersey’s business base is large and heterogeneousChapter 1 · source page 7+
New Jersey’s business base is large and heterogeneous
Statewide averages hide a wide range of firm sizes and risk profiles.
237,968 185,622 3.95M $292.1B
Employer establishments Employer firms Total employment Annual payroll
2023 [S7] 2023 [S7] 2023 [S7] 2023 [S7]
New Jersey is not one security environment. Healthcare, financial services, pharmaceuticals, legal services,
manufacturing, logistics, retail, and professional services differ materially in data sensitivity, regulatory obligations,
technology stacks, and attack surfaces. A statewide AI estimate is useful for scale, but the security question needs
segmentation by industry and size.
Research implication
The final matched study should publish statewide results only when weighting and sample design justify them. Otherwise,
findings should be described as the assessed Blueclone/NJ business sample and broken out into sufficiently large sector
and size cells.
Size bands should align with Census categories when possible to facilitate benchmarking.
Industry should use 2- or 3-digit NAICS where sample size permits.
Very small cells should be combined or suppressed to protect privacy and avoid unstable percentages.
Multi-state operations require explicit geography rules; Census state estimates do not simply count every company with
any NJ establishment.
Sources: S7 · S1
08Data architecture: four evidence layersChapter 1 · source page 8+
Data architecture: four evidence layers
The report keeps adoption, controls, threats and impact separate until a valid join is possible.

 Layer                                          Best current source            What it measures                    Can it prove the NJ gap?

                                                                               Who uses AI, by
 1 · Adoption                                   Census BTOS; Fed surveys                                           Only the adoption side.
                                                                               geography/sector/size

                                                NIST benchmark; proposed NJ    Policy, MFA, DLP, patching,         Yes, once measured in the
 2 · Controls
                                                telemetry/survey               recovery, monitoring                same adopters.

                                                                               Incidents, access paths,            Shows pressure, not adopter
 3 · Threats                                    NJCCIC; FBI; Verizon; Sophos
                                                                               ransomware, credentials             control maturity.

                                                                               Reported losses, breach costs,      Shows consequence, not AI
 4 · Impact                                     IC3; IBM; NJ enforcement
                                                                               regulatory consequences             causation.

  Why this matters
  Without the control layer, the question remains partly unobserved. That missing layer is the research white space: Census
  measures adoption; NJCCIC/FBI measure risk outcomes; regulators define expectations; a privacy-preserving operational
  dataset can measure whether the controls behind adoption actually exist.

Sources: S1 · S8 · S9 · S11 · S14 · S16 · S19 · S31
Chapter 2 · AI Adoption Analysis
09Census BTOS: denominator disciplineChapter 2 · source page 9+
Census BTOS: denominator discipline
The 1.2-million-business figure is a sample framework, not a response count.
~1.2M 6 Nov 17–Feb 8 Biweekly
Employer-business sample Rotating panels 2026 AI supplement collection Core BTOS cadence
framework ~200K businesses each [S1] 2025–2026 [S1] Current business conditions [S1]
BTOS [S1]
Census states that the AI supplement supports differences by industry, geography (including states), and firm size.
Estimates use survey weighting and responding businesses; the sample framework should never be described as 1.2
million completed AI questionnaires. [S1]
Unit: employer business, excluding farms under the BTOS design.
Published percentages are weighted estimates, not raw share of the 1.2 million sample frame.
Question-specific response denominators can differ.
State assignment has special treatment for businesses with establishments in multiple states; state output is not literally
every employer with an NJ footprint.
Uncertainty measures and suppression/reliability flags should accompany state and subgroup estimates when extracted
from the official tables.
Publication-safe wording
“The Census BTOS draws from an approximately 1.2-million-business sample framework.” Do not say “1.2 million
businesses responded to the AI survey.”
Sources: S1 · S3
10The November 2025 AI-definition break changes the storyChapter 2 · source page 10+
The November 2025 AI-definition break changes the story
Older and newer Census AI-use percentages are not directly comparable.

  EARLIER SERIES
  Before November 2025
  Census asked whether businesses used AI in producing goods or services.

  CURRENT SERIES
  From November 2025
  The question broadened to whether businesses used AI in any business function, which captures activities such as
  drafting, research, administrative work and other functions beyond production.

This definition change is analytically material. A chart that connects 2023–2024 percentages to 2026 without a visible
series break can create a false impression of adoption acceleration. The report therefore uses the current-definition
2026 series for its main adoption baseline. [S2][S3]

 Safe comparison                                                   Unsafe comparison

 Compare states/sectors/sizes within the same current-definition
                                                                   Treat 2024 and 2026 AI-use levels as one continuous time series.
 period.

 Use NY Fed’s own consistent 2024–2026 regional question for       Mix NY Fed regional rates with Census state rates as though the
 regional trend.                                                   populations/questions match.

 Label expected-use rates separately from current-use rates.       Add current + planned percentages together.

Sources: S2 · S3 · S5
11New Jersey’s 2026 AI adoption benchmarkChapter 2 · source page 11+
New Jersey’s 2026 AI adoption benchmark
The best public state estimate available in this research pass is 18.5% current use.

Observed percentages from a published LendingTree extraction of U.S. Census BTOS May 2026 state/national data. Current use = past two weeks; planned = expected
                                 use next six months. State cell provenance is secondary extraction of official Census data. [S4]

OBSERVED — LendingTree’s June 15 analysis of the U.S. Census BTOS reports New Jersey at 18.5% current AI use and
20.5% expected use in the next six months. The corresponding U.S. values were 19.8% and 22.8%. [S4]

  DERIVED
  Derived comparison
  New Jersey’s current estimate is 1.3 percentage points below the U.S. rate (about 6.6% lower on a relative basis). NJ
  expected use is 2.0 points above current use, a 10.8% relative increase if expectations were realized. These calculations are
  arithmetic—not forecasts.

  Provenance note
  The exact New Jersey cell was not independently machine-extracted from Census’s downloadable XLSX/API in this
  environment. For publication, retain the attribution to LendingTree’s Census analysis or replace it with the direct Census
  state cell after an independent extraction.

Sources: S1 · S4
12National baseline: AI has moved beyond a fringe behaviorChapter 2 · source page 12+
National baseline: AI has moved beyond a fringe behavior
Nearly one in five U.S. employer businesses reported current use in May 2026.
19.8% 20–23% 17–20% 37%
U.S. current AI use Expected use range Current-use range 250+ employees
May 3, 2026 [S2] Dec 2025–May 2026 [S2] Dec 2025–May 2026 [S2] May 3, 2026 [S2]
Census reviewed six months of BTOS data from December 14, 2025 through May 3, 2026. Overall U.S. AI usage
generally ranged from 17% to 20%, while expected use generally ranged from 20% to 23%. [S2]
Interpretation: adoption is material but far from universal.
The national figure is a business-level estimate; it does not mean 19.8% of employees use AI or 19.8% of business tasks are
AI-assisted.
Expected use is an intention measure, not observed future adoption.
The broader current-definition question makes this series useful for present benchmarking but not naïve year-over-year
comparison with the old question.
Research implication
A statewide NJ governance study no longer asks whether AI is rare enough to ignore. It asks whether businesses that have
already adopted—or expect to adopt—have adequate controls in place before use expands further.
Sources: S2
13Firm size is one of the strongest adoption gradientsChapter 2 · source page 13+
Firm size is one of the strongest adoption gradients
Larger businesses are materially further into AI use.

                             Observed U.S. current AI use by employee-size band from Census-based May 2026 data. [S4]

OBSERVED — Current AI use rises from roughly 19% among 1–4 employee businesses to 37.3% among businesses with
250+ employees. Businesses with 100–249 employees were at 32.0%. [S4]

  DERIVED
  Derived relative rates
  The 250+ rate is about 1.88× the overall U.S. 19.8% rate; the 100–249 rate is about 1.62×. [S2][S4]

This gradient is important for security research because larger organizations often have more complex identity
estates, vendor relationships, data flows, and application portfolios. It does not follow that they are less secure; they
may also have stronger security programs. The study must measure both exposure and control maturity rather than
assuming one from size.
Sources: S2 · S4
14Sector differences are even largerChapter 2 · source page 14+
Sector differences are even larger
Information and finance/insurance are already well above the national adoption rate.
Observed U.S. current AI use in selected sectors, May 2026. National overall = 19.8%. [S2][S4]
DERIVED
Derived contrast
Information-sector use at 39.7% is about 2.0× the overall U.S. rate; finance and insurance at 33.9% is about 1.71×. [S2]
The sector pattern argues against one statewide headline as the entire story. Knowledge-intensive sectors have already
crossed much further into adoption, while retail and construction remain lower. That changes where a New Jersey
security-control study is most likely to find enough AI adopters for meaningful subgroup analysis.
First-wave cohorts: information, professional/scientific/technical services, finance/insurance, education.
Regulated-sector importance: healthcare and finance combine material adoption with sensitive data and compliance
obligations.
Comparison group: lower-adoption sectors help test whether control maturity tracks adoption rather than sector alone.
Sources: S2 · S4
15Northern New Jersey’s regional signal is much fasterChapter 2 · source page 15+
Northern New Jersey’s regional signal is much faster
Federal Reserve regional surveys show sharp 2024–2026 growth.

      Observed business AI use in New York Fed regional surveys covering New York and Northern New Jersey. Services: 25% (2024), 40% (2025), 61% (2026).
                                                  Manufacturing: 16%, 26%, 51%. Regional—not NJ-only. [S5]

OBSERVED — In August 2026, 61% of service firms and 51% of manufacturers in the New York–Northern New Jersey
regional business surveys reported using AI as part of business processes in the prior six months. Knowledge-intensive
sectors such as information, business services, and finance had the highest usage. [S5]

  Do not misuse this number
  61% is not a statewide New Jersey adoption estimate. The New York Fed survey is a regional business survey covering
  New York and Northern New Jersey and uses its own question, timing and sample. Its value here is trend and sector
  context.

Sources: S5
16Adoption breadth is rising faster than adoption depthChapter 2 · source page 16+
Adoption breadth is rising faster than adoption depth
Widespread AI use does not necessarily mean deep operational dependence.

 61%                             51%                             17%                              7%
 Regional service firms using    Regional manufacturers using    Median workers using AI at       Median workers using AI at
 AI                              AI                              adopting service firms           adopting manufacturers
 NY/Northern NJ [S5]             NY/Northern NJ [S5]             [S5]                             [S5]

The same New York Fed research reports that AI investment remained modest for most adopters. About three-quarters
of service firms and more than 90% of manufacturers characterized their AI investment as minimal or modest. Only
around 15% of service firms reported significant investment and roughly 5% major strategic investment. [S5]

  OBSERVED + INFERENCE
  Unexpected finding
  AI can be widespread at the firm level while still touching a minority of workers inside each firm. This matters for security
  measurement: a simple “uses AI” flag can conceal whether AI is one employee’s drafting tool, a company-wide copiloting
  platform, or an agentic system with production permissions.

A mature governance study should therefore capture intensity: number of approved AI tools, percent of workforce
with access, whether sensitive data are allowed, presence of external connectors, whether AI agents act with delegated
credentials, and whether the organization uses public, enterprise, private, or managed AI paths.
Sources: S5
17Third District small businesses: adoption is material butChapter 2 · source page 17+
Third District small businesses: adoption is material but
lower than nationally
A weighted regional sample gives the closest public small-business adoption/security bridge.

Observed weighted Third District estimates from the 2025 Small Business Credit Survey. N=894 small employer firms across Delaware, New Jersey and Pennsylvania.
                                                   AI results were available only regionally at publication. [S6]

OBSERVED — The Philadelphia Fed reports 37% of Third District small employer firms were currently using AI,
compared with 46% nationally. Another 45% had no current use and no plans, 13% planned adoption within 12
months, and 5% were unsure. [S6]

  Population boundary
  These are firms with 1–499 employees across Delaware, New Jersey and Pennsylvania. The article explicitly says the AI-
  module results were only available regionally at the time of writing. The 37% figure cannot be relabeled “New Jersey
  small businesses.”

The SBCS weighting uses variables including firm age, employment size, owner demographics and industry to reflect
each geography. That makes it valuable regional evidence, but still a different instrument and population from Census
BTOS. [S6]
Sources: S6
18Security and privacy are already part of the AI adoptionChapter 2 · source page 18+
Security and privacy are already part of the AI adoption
decision
The regional small-business survey directly connects AI use with control concerns.

    Observed shares citing data security/privacy: 25% among current AI users answering challenge question; 14% among firms with no plans to adopt answering
                                             reasons question. Different denominators; not a direct risk comparison. [S6]

OBSERVED — Among the 37% of Third District firms already using AI, 25% cited data security and privacy as a
challenge. Among the 45% with no plans to use AI, 14% cited data security and privacy as a reason. [S6]

  Critical denominator note
  The 25% and 14% values come from different question populations. They should not be subtracted to claim an 11-point
  “security gap.” What they show is that security/privacy is salient both after adoption and among some nonadopters.

The New York Fed offers a parallel qualitative signal: among regional nonadopters, more than one-third cited data
privacy, security, or confidentiality concerns, alongside similar concerns about accuracy and skill gaps. [S5]
Sources: S5 · S6
Chapter 3 · Security, Governance & Threat Analysis
19A security benchmark needs a defined control standardChapter 3 · source page 19+
A security benchmark needs a defined control standard
NIST CSF 2.0 provides the cross-sector structure; AI-specific guidance adds the AI layer.

 Control domain                            NIST-aligned research question               AI-specific relevance

                                           Are AI use, risk ownership, policies and     Approved tools, accountability, AI risk
 Govern
                                           vendors governed?                            decisions.

                                           Are AI systems, data flows, identities and   Shadow AI, connectors, models, agents,
 Identify
                                           assets inventoried?                          sensitive data.

                                           Are identities, endpoints and data           MFA, least privilege, DLP, encryption,
 Protect
                                           protected?                                   training.

                                           Can misuse, risky sign-ins and abnormal
 Detect                                                                                 Monitoring, SIEM, model/app telemetry.
                                           AI/data activity be detected?

                                           Can the organization contain AI-enabled or   Escalation, IR playbooks, vendor
 Respond
                                           AI-related incidents?                        coordination.

 Recover                                   Are backups and restore procedures tested?   Resilience independent of attack vector.

NIST CSF 2.0 is designed for organizations across sectors and sizes and adds a stronger governance focus. NIST’s Cyber
AI Profile work explicitly addresses managing cybersecurity risks related to AI systems and using AI to enhance cyber
defense. [S11][S12]

  Research use, not certification
  This report uses NIST as a measurement scaffold. It does not claim that any NJ business is “NIST compliant” unless a
  formal assessment supports that statement.

Sources: S11 · S12 · S13
20Minimum viable AI-governance control setChapter 3 · source page 20+
Minimum viable AI-governance control set
A small number of observable controls can support a clear headline metric.

 Control                                  Organization-level pass rule                       Why it matters

                                          Approved/current policy defines permitted use
 Approved AI policy                                                                          Turns informal use into governed use.
                                          and data classes

                                          Approved-tool inventory and managed/private
 Approved AI path                                                                            Reduces shadow-AI ambiguity.
                                          enterprise path where needed

                                          All eligible human and privileged identities       Partial deployment can conceal exposed
 Complete MFA
                                          covered; exceptions documented                     services.

                                          DLP/sensitivity controls cover in-scope
 Data protection                          users/workloads or equivalent documented           AI increases pathways for data movement.
                                          controls

                                          AI vendors/connectors assessed before sensitive
 Vendor review                                                                               Third-party risk is material.
                                          use

                                          Critical exposure and unsupported OS               Vulnerabilities are a leading breach entry
 Patch/endpoint baseline
                                          measured and remediated                            point.

 Tested recovery                          Recent restore test with outcome recorded          Prevention can fail; recovery must be proven.

                                          Risky login/identity and relevant AI/data events
 Monitoring                                                                                  Controls need detection, not merely policy.
                                          observable

  Recommended headline metric
  Report the share of AI adopters that meet all four minimum controls—approved AI policy, complete MFA, data-protection
  coverage, and approved/managed AI path—then publish each component separately so the composite cannot hide the
  mechanism.

Sources: S11 · S12 · S14 · S15
21New Jersey cyber incident reports nearly doubled in 2025Chapter 3 · source page 21+
New Jersey cyber incident reports nearly doubled in 2025
NJCCIC recorded 954 incident reports, with social engineering dominant.

                   Observed NJCCIC cybersecurity incident reports by category, 2025. Total = 954. Information cutoff Dec. 31, 2025. [S8]

OBSERVED — NJCCIC received 954 cybersecurity incident reports in 2025, a 92% increase from 2024. The largest
category was social engineering (561), followed by unauthorized access/hacking (278) and ransomware (48). [S8]

  Interpretation boundary
  These are incident reports received by NJCCIC, not a census of all attacks against New Jersey businesses. Reporting
  behavior, program awareness, and classification changes can affect the count. The threat assessment itself notes that
  actual attacks are likely higher because not all incidents are reported.

Sources: S8
22Breach reporting shows a large ransomware andChapter 3 · source page 22+
Breach reporting shows a large ransomware and
unauthorized-access burden
NJCCIC received 1,951 initial breach reports affecting New Jersey residents in 2025.

               Observed NJCCIC initial data breach reports affecting NJ residents by reported cause, 2025. Total categories sum to 1,951. [S8]

OBSERVED — Of 1,951 initial data breach reports affecting New Jersey residents, 813 were attributed to ransomware
(42%), 676 to unauthorized access, 311 to social engineering, 92 to accidental exposure, 48 to insider theft, and a small
number to other/device-media causes. [S8]

  Denominator discipline
  A breach report is not a New Jersey business. The organization reporting may be based elsewhere, one organization can
  experience more than one event, and the count does not identify whether AI was used by the victim or attacker. Its role is
  consequence context.

Sources: S8
23Credential exposure is a rapidly worsening New Jersey signalChapter 3 · source page 23+
Credential exposure is a rapidly worsening New Jersey signal
NJCCIC issued 94,168 compromised-credential notifications in 2025.

                          Observed NJCCIC compromised-credential notifications: 16,175 (2022), 26,951 (2023), 28,145 (2024), 94,168 (2025). [S8]

  DERIVED
  Derived change
  94,168 notifications in 2025 represent a 234.6% increase over 28,145 in 2024—consistent with NJCCIC’s rounded +235%
  statement. [S8]

NJCCIC explains that compromised credentials can enable unauthorized access while appearing as legitimate logins
and reports that compromised credentials were used for initial access in the majority of ransomware incidents it
analyzed among New Jersey victim organizations. It recommends password changes, unique passwords, password
managers, MFA, and endpoint protection when credentials are exposed. [S8]
For AI governance, identity matters twice: employees authenticate to AI applications, and agents/services may
introduce non-human identities, API keys, service accounts and delegated permissions. A binary “MFA enabled” field is
therefore insufficient; complete eligible-account coverage and privileged/NHI treatment are the stronger measures.
Sources: S8 · S14 · S15
24FBI IC3: New Jersey reported $660.4M in cybercrime losses inChapter 3 · source page 24+
FBI IC3: New Jersey reported $660.4M in cybercrime losses in
2025
The state ranked fifth by reported complaint loss.

                         Observed New Jersey IC3 reported complaint losses: $434.9M in 2024 and $660.4M in 2025. [S9][S10]

 $660.4M                           20,648                                  216.2                                   $31,984
 2025 NJ reported loss             2025 NJ complaints                      Complaints per 100K                     Loss / complaint
 5th among states [S9]             16th by count [S9]                      2025 · rank 42 [S9]                     Derived; not average business loss

  Do not call this a business-loss average
  IC3 complaints include individuals and organizations and cover many crime types. The derived $31,984 is simply total
  reported NJ loss divided by NJ complaint count. It is not the cost of an average NJ business cyber incident.

Sources: S9 · S10
25New Jersey IC3 complaint count and losses both rose sharplyChapter 3 · source page 25+
New Jersey IC3 complaint count and losses both rose sharply
year over year
The loss increase outpaced the complaint increase.

                                 Observed New Jersey IC3 complaints: 15,701 in 2024; 20,648 in 2025. [S9][S10]

 Metric                         2024                                     2025                                    Derived change

 NJ complaints                  15,701                                   20,648                                  +31.5%

 NJ reported losses             $434.9M                                  $660.4M                                 +51.9%

 Loss per complaint             $27,696                                  $31,984                                 +15.5%

DERIVED — Reported losses grew faster than complaint volume from 2024 to 2025. This does not establish that attack
severity increased for a typical business: case mix, high-value outliers, reporting behavior, crypto/investment fraud
and who submitted complaints can all change the aggregate. [S9][S10]

  Use as pressure indicator
  IC3 is best used here to demonstrate the material financial scale of reported cyber-enabled crime touching New Jersey—
  not to estimate the prevalence or average cost of AI-related incidents among NJ businesses.

Sources: S9 · S10
26AI is now explicitly visible in national cybercrime reportingChapter 3 · source page 26+
AI is now explicitly visible in national cybercrime reporting
FBI IC3 added an AI-related descriptor with substantial reported losses.

 22,364                            $893.3M                          >$30M                             1.01M
 AI-related complaints             Adjusted AI-related losses       Business losses from AI-          Total IC3 complaints
 U.S. 2025 [S9]                    U.S. 2025 [S9]
                                                                    involving BEC scams               U.S. 2025 [S9]
                                                                    U.S. 2025 [S9]

OBSERVED — IC3 reports 22,364 complaints with an AI-related descriptor and $893,346,472 in adjusted losses in 2025.
It notes AI can be used to generate convincing synthetic content and states that businesses reported more than $30
million in losses to business-email-compromise scams involving AI. [S9]

  Classification boundary
  “AI related” is an IC3 descriptor, not a single crime type, and it does not mean AI caused the full loss. It identifies
  complaints reporting an AI nexus. These are national numbers, not New Jersey-specific.

This is nevertheless relevant to the study: AI changes both the internal governance surface and the external threat
environment. Controls must therefore address employee/tool use and adversarial use without conflating the two.
Sources: S9
27Verizon 2026: the external attack surface is shiftingChapter 3 · source page 27+
Verizon 2026: the external attack surface is shifting Vulnerabilities, ransomware, third parties and shadow AI all matter to the control model. 31% 48% 48% 45% Breaches starting with Breaches involving Breaches with third-party Employee shadow-AI use software vulnerabilities ransomware involvement signal reported by Verizon 2026 DBIR [S14] 2026 DBIR [S14] 2026 DBIR [S14] Tripled from 15% [S14] Verizon’s 2026 DBIR analyzes more than 31,000 incidents, including more than 22,000 confirmed breaches across 145 countries. Its in-scope incidents ran from November 1, 2024 through October 31, 2025. [S14] Vulnerability exploitation reached 31% of breaches and became the leading initial-access route in Verizon’s analysis. Third-party involvement reached 48%, emphasizing supplier and connector governance. Verizon reports employee use of unapproved “shadow AI” tripled to 45%, a direct reason to measure approved-tool inventory and data controls. These are global/multi-source breach findings—not estimates of how many NJ businesses have each exposure. Control implication An AI-readiness benchmark that measures policy but ignores patching, third parties, identity and shadow-AI pathways would miss the mechanisms currently prominent in breach evidence. Sources: S14
28Identity control maturity cannot be reduced to “MFA exists”Chapter 3 · source page 28+
Identity control maturity cannot be reduced to “MFA exists”
Sophos’ 2026 identity survey exposes visibility and coverage gaps.

 5,000                                71%                            24%                            3
 IT/cybersecurity leaders             Reported ≥1 identity-related   Continuously monitor unusual   Average identity attacks
 17 countries · 14 industries [S15]
                                      breach                         login attempts                 among affected organizations
                                      Prior 12 months [S15]          [S15]                          [S15]

Sophos surveyed 5,000 IT and cybersecurity leaders in organizations across 17 countries and 14 industries. Seventy-
one percent reported at least one identity-related breach in the previous year; only 24% continuously monitored
unusual login attempts. Smaller organizations with 100–250 employees were reported as nearly twice as likely as
midsized peers to fail to detect and stop their most significant identity attack before damage occurred. [S15]

  Population boundary
  This is a multinational vendor-commissioned survey of organizations, not a representative sample of New Jersey
  businesses. It is used to define what to measure—not to estimate NJ breach prevalence.

The AI relevance is structural: cloud AI services, copilots and agents can add human accounts, service accounts, non-
human identities, tokens and delegated permissions. A useful NJ benchmark must distinguish coverage by identity
class.
Sources: S15
29Ransomware evidence reinforces the identity-coverageChapter 3 · source page 29+
Ransomware evidence reinforces the identity-coverage
problem
A victim-only sample shows why partial MFA can coexist with compromise.

 2,158                          79%                               97%                                   56%
 Ransomware-hit organizations   Attacks starting with identity-   Credential-root-cause victims         Attacks that encrypted data
 surveyed                       based approach                    with some MFA                         Victim sample [S16]
 17 countries [S16]             Victim sample [S16]               Coverage gaps remained [S16]

Sophos’ 2026 State of Ransomware survey included 2,158 IT/security leaders specifically at organizations that had
experienced ransomware in the prior 12 months. Malicious email (26%), phishing (24%), compromised credentials
(23%) and exploited vulnerabilities (18%) were leading cited root causes. [S16]

  Victim-only denominator
  These results cannot estimate the chance that a random NJ business will suffer ransomware. They describe attack paths
  and outcomes among organizations that were already ransomware victims.

The 97% MFA statistic is especially useful for research design: “MFA enabled somewhere” is a weak control measure.
The matched NJ study should calculate MFA-protected eligible accounts / all eligible accounts, separately for human,
privileged, VPN/firewall, external and relevant non-human identities.
Sources: S16
30Breach economics are material—but global averages mustChapter 3 · source page 30+
Breach economics are material—but global averages must
stay global
IBM’s 2026 study adds consequence and security-automation context.

 602                           $4.99M                         56%                              $1.93M
 Breached organizations        Global average breach cost     Increase in AI-driven attacks    Lower cost with extensive
 studied                       +12% [S17]                     IBM 2026 [S17]
                                                                                               security AI/automation
 IBM/Ponemon 2026 [S17]                                                                        vs none [S17]

IBM’s 2026 Cost of a Data Breach research studied 602 organizations impacted by data breaches. The global mean was
$4.99 million; IBM reports AI-driven attacks increasing 56% and $1.93 million lower costs among organizations making
extensive use of security AI and automation compared with those using none. [S17]

  Do not localize improperly
  The report does not say “the average NJ SMB breach costs $4.99M.” IBM’s breached-organization sample, company-size
  mix, geography and cost methodology do not support that interpretation.

IBM’s 2025 research also reported a striking AI-governance gap among organizations that had AI-related security
incidents: 97% lacked proper AI access controls, and 63% lacked AI governance policies. Those findings are useful
prior art, not a New Jersey prevalence estimate. [S18]
Sources: S17 · S18
Chapter 4 · New Jersey Regulation & Sector Implications
31New Jersey regulators are already examining AI andChapter 4 · source page 31+
New Jersey regulators are already examining AI and
cybersecurity together
The Bureau of Securities is explicitly testing both topics across nearly 800 advisory firms.

 ~800                            AI + cyber                         Written                         Vendor
 NJ-registered investment
 adviser firms
                                 Joint examination focus
                                                                    controls                        diligence
                                 Sensitive data and emerging risk
 2026 examination [S19]          [S19]                              Cyber policies & procedures     Ongoing third-party
                                                                    Requested [S19]
                                                                                                    cybersecurity due diligence
                                                                                                    Requested [S19]

In June 2026, the New Jersey Bureau of Securities announced its annual examination of nearly 800 NJ-registered
investment adviser firms would focus on protecting sensitive data and emerging AI risks. The examination seeks
information about AI use and asks about cybersecurity practices including written policies and procedures, periodic
employee training, and ongoing third-party vendor cybersecurity due diligence. [S19]

  What this does—and does not—prove
  The regulator’s questionnaire shows that AI and cybersecurity are now jointly material supervisory topics. It does not
  reveal how many firms passed or failed each control because the response results are not publicly reported.

This is strong support for the report’s matched-design logic: in at least one regulated NJ sector, the state itself is
treating AI adoption and cyber governance as linked risk-assessment questions.
Sources: S19
32New Jersey privacy law makes data governance a concreteChapter 4 · source page 32+
New Jersey privacy law makes data governance a concrete
control question
Reasonable security and data-minimization duties directly intersect with AI use.

 Legal requirement / theme                                                 Research measurement implication

                                                                           Ask whether AI use has defined data-purpose and minimization
 Limit collection to adequate, relevant, reasonably necessary data
                                                                           rules.

 Reasonable administrative, technical and physical safeguards              Measure actual technical coverage, not policy existence alone.

 Protect confidentiality, integrity and accessibility during storage and
                                                                           Trace AI data paths, storage, connectors and downstream handling.
 use

                                                                           Identify whether sensitive data are permitted in AI workflows and
 Sensitive-data consent obligations
                                                                           on what basis.

                                                                           Capture whether relevant AI processing is assessed/documented
 Heightened-risk processing assessments
                                                                           before deployment.

New Jersey’s 2023 privacy law requires reasonable administrative, technical, and physical data-security practices
appropriate to the volume and nature of personal data. P.L. 2026, c.25, approved June 30, 2026, amended the regime
while retaining these security duties and adding/clarifying provisions including sensitive-data treatment. [S20][S21]

  Not legal advice
  The research uses statutes to identify measurable governance dimensions. Whether a specific organization or AI use case
  is legally covered requires legal analysis of the facts, exemptions, definitions and effective provisions.

Sources: S20 · S21
33Enforcement deep dive: identity basics can failChapter 4 · source page 33+
Enforcement deep dive: identity basics can fail
catastrophically
The Enzo case shows why AI governance cannot replace core cyber hygiene.

 2.4M                            ~331,600                        $4.5M                           MFA
 Patients affected nationwide    New Jersey residents affected   Multistate settlement           Required for all user accounts
 2023 breach [S22]               [S22]                           NJ >$930K [S22]
                                                                                                 under settlement measures
                                                                                                 [S22]

The New Jersey Attorney General’s 2024 Enzo Biochem settlement followed a 2023 ransomware breach affecting
approximately 2.4 million patients nationwide, including about 331,600 New Jersey residents. State investigators
described deficient data-security practices. The agreement required stronger controls and a $4.5 million payment.
[S22]
The case materials describe shared employee credentials, long-lived credentials and inadequate monitoring; the
remedial requirements include stronger access policies, MFA, encryption, risk assessments and incident-response
measures. These are exactly the foundational controls that should be tested alongside AI adoption.

  Research lesson
  A company can have sophisticated AI ambitions while still being exposed by basic identity or monitoring failures.
  Therefore, the study’s “security readiness” side must include foundational controls rather than only AI-specific policy
  questions.

Sources: S22
34Third-party risk is part of the AI security boundaryChapter 4 · source page 34+
Third-party risk is part of the AI security boundary
AI introduces vendors, connectors and data processors; breach evidence already shows the consequence of weak
oversight.

The New Jersey Attorney General’s Morgan Stanley settlement involved two data-security incidents affecting more
than 3.37 million individuals nationwide, including 755,592 New Jersey residents, and centered on data disposal and
vendor-management failures. The settlement imposed stronger security and disposal requirements. [S23]
Verizon’s 2026 DBIR independently reports third-party involvement in 48% of breaches, up sharply year over year.
[S14]

 AI vendor-risk field                      What to record                                Why

 approved_ai_vendor                        Vendor/product category + approval status     Separates sanctioned from shadow use.

 data_classes_allowed                      None/public/internal/confidential/regulated   Defines exposure boundary.

 connector_scope                           Mail/files/CRM/code/database/other            Measures delegated access.

 vendor_review_date                        Most recent review                            Tests governance currency.

                                           Retention/training/subprocessor controls
 contract_data_terms                                                                     Captures contractual data risk.
                                           documented?

                                                                                         Supports response and third-party
 incident_notification_terms               Yes/no/unknown
                                                                                         coordination.

  Inference
  As AI shifts from standalone chat tools toward integrated agents and copilots, third-party governance becomes both a
  privacy issue and an identity/access issue. This is a research hypothesis about control importance—not a claim that AI
  caused the cited breaches.

Sources: S14 · S23
35Healthcare & life sciences: sensitive data raises theChapter 4 · source page 35+
Healthcare & life sciences: sensitive data raises the
consequence of weak AI controls
New Jersey’s sector mix makes privacy, identity and recovery controls especially consequential.

Blueclone’s company materials identify healthcare, pharmaceutical and life-sciences organizations among its
regulated-sector focus. New Jersey’s enforcement record, including Enzo, shows the consequence side of inadequate
identity and data safeguards in a healthcare/lab context. [S22][S27]

 AI governance question                                           Healthcare/life-sciences measurement

 What data enter AI tools?                                        PHI/PII/clinical/HR/research data classes; permitted vs prohibited.

 Who can access AI workflows?                                     Workforce, contractors, privileged users, service accounts.

 Where are prompts/outputs retained?                              Retention, logging, model training policy, data residency if relevant.

 Can sensitive content leave approved boundaries?                 DLP, upload restrictions, browser/SaaS controls.

 How are outputs reviewed?                                        Human review for clinical, regulatory or business-critical use.

 Can systems recover after compromise?                            Backups + verified restores of critical workloads.

  Claim boundary
  This report does not infer that New Jersey healthcare AI adopters are less secure than other sectors. It argues that the
  consequence of governance failure can be higher when regulated or sensitive data are involved.

Sources: S22 · S27 · S20
36Financial services: AI adoption is high and supervision isChapter 4 · source page 36+
Financial services: AI adoption is high and supervision is
explicit
National adoption and New Jersey examination evidence make finance a high-value matched cohort.

 33.9%                           ~800                             AI use                        Cyber
 U.S. finance/insurance AI use   NJ investment adviser firms in
                                 2026 exam
                                                                  Regulator asks about
                                                                  emerging AI risk
                                                                                                controls
 May 2026 [S2]
                                 [S19]                            [S19]                         Policies, training, vendor
                                                                                                diligence
                                                                                                [S19]

Finance and insurance had one of the highest national AI-use rates in Census BTOS at 33.9%. In New Jersey, the Bureau
of Securities’ 2026 examination explicitly pairs AI-use questions with cybersecurity and sensitive-data controls for
nearly 800 investment adviser firms. [S2][S19]

  Best sector hypothesis
  Among New Jersey financial-services firms using AI, the most newsworthy measurement is not whether a policy exists in
  isolation, but whether approved AI use is backed by complete identity coverage, documented vendor review, controlled
  sensitive-data paths, monitoring and tested incident/recovery procedures.

This sector also demonstrates why firm-level matching matters. A high adoption rate does not imply weak security;
regulated firms may have stronger baseline governance. Only the matched study can reveal whether control maturity
keeps pace.
Sources: S2 · S19
37Legal and professional services: high adoption potential,Chapter 4 · source page 37+
Legal and professional services: high adoption potential,
confidentiality stakes
Knowledge work amplifies both AI utility and data-governance sensitivity.

Census-based sector data show professional, scientific and technical services among the higher-adoption categories
nationally. New York Fed regional evidence similarly reports highest use in knowledge-intensive sectors such as
information, business services and finance. [S4][S5]

 Risk surface                                                 Example measurement

                                                              Policy on pasting client documents into AI; DLP coverage; approved
 Client confidentiality
                                                              vendors.

 Matter/work-product data                                     Sensitivity labeling and external-sharing controls.

 Research/drafting outputs                                    Human-review requirements and source verification.

                                                              MFA coverage across Microsoft 365, VPN, file systems and AI
 Identity
                                                              connectors.

 Third parties                                                AI vendor due diligence and subprocessors.

 Auditability                                                 Logs for tool access, data movement and administrative changes.

  Why this cohort matters
  Professional-services firms often combine high-value information with smaller IT teams. That makes them useful for
  testing whether adoption intensity, company size and managed-security maturity interact. The study should not assume
  the result in advance.

Sources: S4 · S5 · S27
Chapter 5 · Synthesis, Answer & Original Contribution
38Cross-dataset proof matrixChapter 5 · source page 38+
Cross-dataset proof matrix
Which parts of the “outrunning security” proposition are actually observed?

 Proposition                                        Evidence today                     Status                        What would close the gap

 NJ businesses are using AI at                      18.5% current; 20.5% planned in                                  Direct official state-cell extraction
                                                                                       SUPPORTED
 material scale                                     Census-based state extraction                                    for final audit trail.

 Adoption is concentrated in                        Census + NY Fed sector/size                                      NJ-specific sector × size cells if
                                                                                       SUPPORTED
 larger / knowledge sectors                         patterns                                                         available.

 Cyber pressure on NJ                               NJCCIC incidents, breaches,                                      No additional evidence required
                                                                                       SUPPORTED
 organizations is material                          credentials; FBI losses                                          for descriptive claim.

 Security/privacy constrains some                   Third District + NY Fed regional                                 NJ-only business survey for state
                                                                                       SUPPORTED regionally
 AI adoption                                        survey responses                                                 estimate.

 NJ AI adopters lack adequate                                                                                        Telemetry/survey in same
                                                    No matched public denominator      UNKNOWN
 controls                                                                                                            adopting organizations.

 AI adoption causes more NJ                                                                                          Longitudinal/causal study with
                                                    No causal design                   NOT ESTABLISHED
 breaches                                                                                                            confounder control.

 Security controls reduce AI-related                                                                                 Incident/outcome panel; external
                                                    No NJ causal estimate              UNKNOWN
 loss in NJ                                                                                                          benchmarks only.

  PUBLICATION-SAFE CONCLUSION
  The answer in one sentence
  AI adoption is expanding into a demonstrably high-pressure security environment, but the public evidence does not yet
  prove that security controls are lagging adoption within the same New Jersey businesses.

Sources: S4 · S5 · S6 · S8 · S9 · S14 · S15 · S17
39Answer to the research questionChapter 5 · source page 39+
Answer to the research question
The strongest conclusion is a measured “not yet proven,” not a weak result.

The question “Is AI adoption outrunning security in New Jersey businesses?” contains two measurable trajectories:
adoption and control maturity. The adoption trajectory is now visible. The control-maturity trajectory is not publicly
measured with a comparable NJ business denominator.

  What the evidence supports
  AI adoption is established and uneven; high-adoption pockets are already substantial. Cyber incidents, credential
  exposure and reported losses in New Jersey are material. Security/privacy is a reported adoption challenge for some
  regional small businesses. State regulators are already asking firms about AI and cybersecurity together.

  What the evidence does not support
  A statewide percentage of AI adopters lacking controls; a claim that AI caused New Jersey’s incident or loss growth; a
  claim that 71% of NJ firms suffered identity breaches; a claim that the average NJ SMB breach costs $4.99M; or a
  subtraction of adoption and security figures from unrelated samples.

The missing measurement is itself publishable white space. A rigorously designed matched cohort could turn a broad
policy/security question into an original benchmark that Census, NJCCIC, FBI, and vendor studies cannot answer
individually.
Sources: S4 · S6 · S8 · S9 · S17 · S19
40Unexpected and null findingsChapter 5 · source page 40+
Unexpected and null findings
The evidence does not support a simple “AI = immediate workforce or security collapse” narrative.
AI use can be broad at the organization level while shallow inside the workforce: median worker penetration among
adopting regional service firms was 17% and manufacturing 7%. [S5]
Most regional adopters described AI investment as minimal or modest, which suggests experimentation and partial
deployment remain common. [S5]
New York Fed research found layoffs attributable to AI remained uncommon; only 4% of service firms reported AI-related
layoffs and none of the manufacturers did in that survey. [S5]
Security/privacy concerns can slow adoption: more than one-third of regional nonadopters cited
privacy/security/confidentiality concerns. [S5]
Third District AI users report data security/privacy as a challenge, but 28% reported no AI-related challenges at all. [S6]
High AI adoption in finance and knowledge sectors does not demonstrate lower security maturity; regulation may push in
the opposite direction.
Why null findings matter
A credible study must allow the possibility that controls keep pace, or that security-conscious firms adopt more slowly. If
matched telemetry shows no governance gap—or a smaller one than expected—the conclusion must change with the
evidence.
Sources: S5 · S6 · S19
41Prior art: New Jersey AI research exists, but the matchedChapter 5 · source page 41+
Prior art: New Jersey AI research exists, but the matched
cyber-control benchmark is still open
Originality comes from the join, not from claiming nobody has studied AI adoption.

Rutgers’ New Jersey State Policy Lab and the Heldrich Center launched research in 2026 on how New Jersey public AI
initiatives can better meet the needs of small businesses, particularly minority- and women-owned firms. The work
includes focus groups, labor-market analysis and literature review and explicitly identifies small businesses as
underrepresented in AI-related research. [S25][S26]
That work is important prior art for adoption needs and policy. It does not duplicate the study proposed here: a
quantitative, organization-level benchmark joining AI use to technical/security controls such as MFA coverage, DLP,
vendor governance, patch latency, monitoring and tested recovery.

 Prior evidence                               What it contributes                        What remains open

 Census BTOS                                  State/sector/size AI adoption              Matched cyber controls.

 NY/Philly Fed                                Regional adoption, workforce, challenges   NJ-only matched control maturity.

                                              NJ small-business needs and qualitative
 Rutgers/Heldrich                                                                        Operational control benchmark.
                                              context

                                                                                         Whether AI adopters are better/worse
 NJCCIC/FBI                                   Threats, incidents, reported loss
                                                                                         controlled.

 NIST/vendor research                         Control frameworks and global benchmarks   NJ prevalence by business cohort.

Sources: S25 · S26 · S1 · S5 · S6 · S8 · S9
42Original contribution: a matched New Jersey AI-governanceChapter 5 · source page 42+
Original contribution: a matched New Jersey AI-governance
benchmark
The study becomes genuinely original when adoption and controls share the same denominator.

  Proposed contribution
  Create a privacy-preserving panel of New Jersey employer organizations where AI use, approved-tool status, policy, MFA,
  DLP, patching, backup/recovery, vendor review and monitoring are assessed within a common observation window.
  Compare adopters with nonadopters and publish sector/size cohorts where sample size permits.

1.   Benchmark NJ AI adoption against Census/Federal Reserve external data.
2.   Measure organization-level minimum-control pass rates among AI adopters.
3.   Compare adopter vs nonadopter control maturity without implying causation.
4.   Test whether governance gaps vary by sector and company size.
5.   Normalize identity incidents by monitored user-months where data quality allows.
6.   Publish numerator, denominator, missingness and minimum cell-size rules.
7.   Repeat on a fixed cadence to test whether controls catch up as adoption expands.

  HYPOTHESIS-TO-HEADLINE GATE
  Potential media result — only after measurement
  “X% of AI-adopting New Jersey businesses in the assessed sample lacked at least one minimum governance control.” X
  should not exist until the real numerator and denominator are calculated.

Sources: Method: S31 · external benchmarks: S1 · S5 · S6
43Red-team analysis: alternative explanations and confoundersChapter 5 · source page 43+
Red-team analysis: alternative explanations and confounders
A security gap can be manufactured statistically if the study ignores who adopts AI.

 Potential confounder                    How it could distort the result                 Mitigation

                                         Larger firms adopt more AI and may also have
 Firm size                                                                               Stratify/multivariable adjustment.
                                         stronger controls.

                                         Finance/healthcare may have both high
 Industry                                                                                Industry fixed effects / matched cohorts.
                                         adoption and regulation.

                                         Blueclone clients may be more security-mature   Describe sample; external weighting only if
 Managed IT selection
                                         than NJ average.                                defensible.

 Observation coverage                    Missing DLP telemetry can look like “no DLP.”   Separate unknown from absent.

 Tool intensity                          One-off AI drafting ≠ agentic production use.   Measure adoption intensity.

 Security investment                     More mature firms may adopt AI sooner.          Measure baseline maturity / pre-period.

                                         Organizations with mature programs              Normalize and interpret incident rate
 Reporting propensity
                                         detect/report more incidents.                   cautiously.

                                         Adoption and control snapshots from different
 Time alignment                                                                          Use common observation windows.
                                         periods can mislead.

  Conditions that would weaken the hypothesis
  If AI adopters have equal or stronger complete-control coverage than comparable nonadopters after size/sector
  adjustment—or if gaps disappear under reasonable missing-data treatments—the “outpacing” hypothesis should be
  weakened or rejected.

Sources: S31
Chapter 6 · Methodology & Matched Study Design
44Full methodologyChapter 6 · source page 44+
Full methodology
A reproducible matched-cohort design for the next-stage empirical test.

 Design element                                                Specification

                                                               Among assessed NJ employer organizations, what share of current AI adopters
 Primary question
                                                               lacks the predefined minimum control set?

                                                               NJ employer organizations in sampling frame; separately report Blueclone-
 Population
                                                               managed/assessed population if convenience sample.

                                                               Organization/tenant; secondary account/device/workload units roll up to
 Unit of analysis
                                                               organization.

 Exposure                                                      Current AI use in any business function; intensity tier if available.

 Primary outcome                                               Governed AI Adoption Rate / Governance Gap Rate.

                                                               Complete MFA, DLP coverage, vendor review, patch latency, tested recovery,
 Secondary outcomes
                                                               monitoring.

 Comparison groups                                             Adopters vs nonadopters; industry; size bands; regulated vs other.

                                                               Prefer 12 months of telemetry with point-in-time governance survey aligned to
 Window
                                                               end date.

 Inclusion                                                     NJ geography, valid org ID, minimum observation coverage.

                                                               Duplicates, test tenants, insufficient observation period, unverifiable
 Exclusion
                                                               geography.

 Missingness                                                   Unknown ≠ absent; report variable-specific denominators.

                                                               Weighted descriptive rates where justified; Wilson/robust CIs; logistic models
 Statistics
                                                               only if sample supports.

                                                               Recompute denominators, inspect outliers, sensitivity analyses, red-team
 Validation
                                                               alternative explanations.

  Primary principle
  Use the simplest defensible method. A transparent cross-tab with correct denominators is better than an unstable
  multivariable model on a small convenience sample.

Sources: S31
45Statistical treatment & sensitivity planChapter 6 · source page 45+
Statistical treatment & sensitivity plan
The analysis should quantify uncertainty without pretending convenience data are representative.
For survey-derived proportions, report weighted estimate, unweighted N where available, denominator definition and
confidence interval consistent with survey design.
For Blueclone telemetry, report exact organization counts and percentages; do not apply statewide population weights
unless the sample design supports them.
Use organization-level pass/fail outcomes alongside account-level coverage rates so 99% account coverage does not hide
incomplete organizational coverage.
Use Wilson intervals for simple binomial proportions when survey design weights are not involved and cell sizes are
adequate.
Predefine minimum publication cell size (for example, n≥20 organizations) and combine/suppress smaller cohorts.
Run sensitivity analysis treating missing controls as (a) unknown/excluded, (b) absent, and (c) present where
documentation supports; publish the range if conclusions change.
If modeling adopter vs nonadopter differences, control for size and industry at minimum; consider managed-service
tenure and baseline maturity if available.
For incident rates, normalize by user-months or organization-months and avoid causal language unless temporal ordering
and confounding are addressed.
Meaningful finding criterion
A statistically detectable difference is not automatically operationally meaningful. Publish absolute percentage-point
differences, denominators and confidence intervals alongside p-values/effect estimates where used.
Sources: Methodology specification: S31
46Proposed matched New Jersey studyChapter 6 · source page 46+
Proposed matched New Jersey study
The public-data report becomes a first-party benchmark with one privacy-preserving export and one short governance
survey.

 Workstream                               Operational data                      Survey data                            Output

                                          ai_use_current; approved AI           Use cases; employee access; public
 Adoption                                                                                                              Adopter denominator + intensity.
                                          inventory                             vs enterprise/private

                                          eligible/protected accounts;
 Identity                                                                       Exception governance                   Complete MFA + identity maturity.
                                          privileged/NHI; risky sign-ins

                                          DLP in-scope/covered; sensitivity     Permitted/prohibited data; vendor
 Data                                                                                                                  Controlled data-path rate.
                                          labels; external sharing              data terms

                                          asset count; OS lifecycle; critical                                          Exposure / remediation
 Endpoint                                                                       —
                                          patch lag                                                                    distribution.

                                          backup coverage; restore-test
 Recovery                                                                       Recovery ownership                     Proven recovery rate.
                                          date/result

                                                                                Policy; training; output review;
 Governance                               Tool inventory if operational                                                AI governance pass rate.
                                                                                executive ownership

                                          identity incident count;              Known AI-related incidents if
 Incidents                                                                                                             Normalized incident context.
                                          observation months                    validated

  Privacy by design
  No raw prompts, message content, customer documents, usernames, patient/client data, or other personally identifiable
  content is required for this research question. Use stable randomized organization IDs and aggregated control counts.

Sources: Proposed research design derived from S11 · S12 · S31
47Data dictionary: minimum fields for reproducible analysisChapter 6 · source page 47+
Data dictionary: minimum fields for reproducible analysis
The final dataset should make every numerator and denominator explicit.

 Field                                     Format / granularity                  Purpose                               Priority

 org_id_hash                               Stable random ID                      Join records without client name      Essential

 state                                     NJ / PA / NY / other                  Define cohort                         Essential

 industry_naics                            2–3 digit                             Sector comparison                     Essential

 employee_band                             Census-compatible                     Size comparison                       Essential

 ai_use_current                            Yes/No/Unknown + date                 Adopter definition                    Essential

 ai_policy_status                          Approved/Draft/None/Unknown           Governance                            Essential

 ai_tools_approved                         Count/categories                      Approved path                         Essential

 mfa_eligible_accounts                     Count                                 Identity denominator                  Essential

 mfa_protected_accounts                    Count                                 Identity numerator                    Essential

 privileged_accounts                       Count + protected count if possible   Elevated access                       High

 legacy_auth_enabled                       Yes/No/count                          Identity exposure                     High

 dlp_in_scope_users                        Count                                 DLP denominator                       Essential

 dlp_covered_users                         Count                                 DLP numerator                         Essential

 endpoint_count                            Managed valid assets                  Endpoint denominator                  Essential

 critical_patch_lag_days                   Device/CVE or quantiles               Remediation maturity                  Essential

 backup_workloads                          Count                                 Recovery denominator                  High

 successful_backup_workloads               Count                                 Nominal protection                    High

 restore_test_date/result                  Date + pass/fail/partial              Actual recoverability                 Essential

 identity_incident_count                   Monthly                               Incident numerator                    High

 user_months_monitored                     Monthly                               Rate denominator                      High

 observation_start/end                     Dates                                 Exposure window                       Essential

Sources: Proposed fields; no fabricated data. Method basis: S31.
48Publication-safe claims—and claims that should not beChapter 6 · source page 48+
Publication-safe claims—and claims that should not be
published
The report is designed to be quoted without overstating the evidence.

 Safe now                                                                      Do not publish yet

 A Census-based analysis reports 18.5% current AI use among NJ                 “X% of NJ AI adopters lack proper governance.” No matched control
 businesses in May 2026. [S4]                                                  denominator exists.

 AI use is substantially higher in larger and information-intensive U.S.       “AI adoption is causing New Jersey cyber incidents to rise.” No causal
 business groups. [S2][S4]                                                     evidence.

 NJCCIC received 954 incident reports in 2025, up 92%. [S8]                    “954 NJ businesses were breached.” Incidents ≠ unique businesses.

                                                                               “94,168 NJ employees were hacked.” Notifications ≠ unique
 NJCCIC issued 94,168 compromised-credential notifications in 2025. [S8]
                                                                               people/incidents.

                                                                               “The average NJ SMB breach costs $31,984 or $4.99M.” Neither
 IC3 records $660.4M in reported NJ complaint losses in 2025. [S9]
                                                                               denominator supports that.

                                                                               “25% of NJ AI users have inadequate security.” Concern ≠ control failure
 Third District AI users report data security/privacy as one challenge. [S6]
                                                                               and region ≠ NJ-only.

 NJ regulators are examining AI and cybersecurity together in investment       “NJ advisers have widespread AI control failures.” Examination results
 advisers. [S19]                                                               are not public.

  JOURNALIST-SAFE FRAMING
  Preferred headline today
  “AI Use Is Material in New Jersey as Cyber Incident Reports Nearly Double—But No Public Benchmark Yet Shows Whether
  Business Security Controls Are Keeping Pace.”

Sources: S4 · S8 · S9 · S19
49Journalist guidance & dashboard blueprintChapter 6 · source page 49+
Journalist guidance & dashboard blueprint
Readers should be able to see the denominators behind every chart.

  Journalist-ready framing
  A Census-based analysis reports 18.5% of New Jersey businesses using AI in May 2026, while NJCCIC recorded a 92% rise
  in incident reports during 2025. Regional Federal Reserve evidence shows much higher AI use in knowledge-intensive
  businesses and identifies data security/privacy as an adoption challenge. The missing number is the most important one:
  no public dataset currently shows what share of NJ AI adopters has complete governance and security controls.

 Dashboard module                          Data / chart                                    Required disclosure

 Overview                                  NJ current/planned AI; NJ incidents; IC3 loss   Source, period, denominator, evidence label.

 Adoption explorer                         State/sector/size adoption                      Question wording + series break.

 Security pressure                         NJCCIC incidents, breaches, credentials         Report counts ≠ businesses.

 Control explorer                          Policy, MFA, DLP, recovery by cohort            Numerator + denominator on hover.

 Matched gap                               Governed Adoption Rate                          Only when same organizations measured.

 Methods                                   Sampling, definitions, missingness, CI rules    Versioned methodology.

 Sources                                   Direct source links and downloads               Publisher/date/coverage.

                                           Aggregate CSV + data dictionary where
 Downloads                                                                                 Privacy/suppression rules.
                                           publishable

  Visual rule
  Every quantitative visual should state the source, sample/population, denominator, period, and whether values are
  observed or derived. Unknowns should render as unknown—not zero.

Sources: Dashboard specification: S31
Chapter 7 · Sources, Evidence Ledger & Research Trace
50Source ledger · Part 1Chapter 7 · source page 50+
Source ledger · Part 1
Primary/public adoption, government and methodological sources.

 ID                                Source                           Publisher / class                 Period · use                       Key limitation

                                                                                                      AI supplement Nov 17, 2025–
                                   Business Trends and Outlook
                                                                    U.S. Census Bureau ·              Feb 8, 2026 · BTOS                 Sample frame ≠ completed
 S1                                Survey Data Release — May 7,
                                                                    Government primary                methodology;                       responses.
                                   2026
                                                                                                      state/industry/size availability

                                                                                                      Data through May 3, 2026 ·
                                   Large Firms With at Least 20     U.S. Census Bureau ·
 S2                                                                                                   National, sector, firm-size AI     Not a direct NJ cell table.
                                   Employees Biggest AI Users       Government primary analysis
                                                                                                      findings; wording change

                                                                    U.S. Census Bureau ·              2026 AI supplement · Question
                                   BTOS AI Supplement
 S3                                                                 Government primary                definitions and implementation     Instrument, not results.
                                   Questionnaire
                                                                    instrument                        variables

                                   Big Companies Are Racing                                           May 2026 BTOS · NJ 18.5%
                                                                    LendingTree · Secondary                                              NJ estimate used via secondary
 S4                                Ahead on AI — but Few Are                                          current / 20.5% planned;
                                                                    analysis of Census                                                   extraction of official data.
                                   Cutting Jobs                                                       state/size/sector tables

                                                                                                      Aug. 2026; trend 2024–26 ·
                                   Businesses Are Using AI to       Federal Reserve Bank of New       NY/Northern NJ AI adoption,
 S5                                                                                                                                      Regional, not NJ-only.
                                   Transform Work, Not Cut Jobs     York · Federal Reserve research   investment depth, workforce
                                                                                                      effects

                                   Small Business Credit Survey:    Federal Reserve Bank of           Fall 2025 · N=894 Third District
                                                                                                                                         AI module region-only at
 S6                                2026 Insights into the Third     Philadelphia · Federal Reserve    small employers; AI
                                                                                                                                         publication.
                                   District Region                  survey                            use/challenges

                                                                                                      2023 business data · Employer
                                                                    U.S. Census Bureau ·
 S7                                QuickFacts: New Jersey                                             firms, establishments,             General business context.
                                                                    Government primary
                                                                                                      employment, payroll

                                                                                                      Information cutoff Dec. 31, 2025
                                                                                                                                         Reporting dataset;
                                   2026 New Jersey Statewide        NJ OHSP / NJCCIC · State          · 954 incidents; 1,951 breach
 S8                                                                                                                                      underreporting; not business
                                   Threat Assessment                government primary                reports; 94,168 credential
                                                                                                                                         prevalence.
                                                                                                      notifications

                                                                                                      Calendar 2025 · NJ
                                                                    Federal Bureau of Investigation                                      Reported complaints; mixes
 S9                                2025 IC3 Annual Report                                             complaints/loss; AI-related
                                                                    · Federal government primary                                         people/orgs; not all cybercrime.
                                                                                                      national complaints/loss

                                                                    Federal Bureau of Investigation   Calendar 2024 · Baseline for NJ
 S10                               2024 IC3 Annual Report                                                                                Same reporting limitations.
                                                                    · Federal government primary      complaint/loss trend

Sources: Direct URLs are listed in the next appendix page to preserve reproducibility.
51Source ledger · Part 2Chapter 7 · source page 51+
Source ledger · Part 2
Security frameworks, industry benchmarks, state regulation and prior art.

 ID                     Source                                  Publisher / class                    Use                                 Limitation

                                                                                                     Cross-sector security outcome
 S11                    Cybersecurity Framework 2.0             NIST · Government standard                                               Framework, not prevalence data.
                                                                                                     structure

                        Cybersecurity Framework Profile
 S12                    for Artificial Intelligence (Cyber AI   NIST · Government draft              AI cybersecurity risk governance    Draft; not final standard.
                        Profile), preliminary draft

                        AI Risk Management Framework:
 S13                                                            NIST · Government guidance           AI risk categories/actions          Voluntary guidance.
                        Generative AI Profile

                                                                                                     31K+ incidents / 22K+ breaches;
                        2026 Data Breach Investigations         Verizon · Industry incident                                              Incident corpus, not
 S14                                                                                                 initial access, ransomware, third
                        Report                                  research                                                                 representative NJ business survey.
                                                                                                     parties

                                                                                                     N=5,000; identity breach/control    Multinational vendor-
 S15                    State of Identity Security 2026         Sophos · Industry survey
                                                                                                     context                             commissioned survey.

                                                                                                     N=2,158 ransomware-hit orgs;
 S16                    State of Ransomware 2026                Sophos · Industry survey                                                 Victim-only sample.
                                                                                                     attack paths and MFA coverage

                                                                IBM / Ponemon · Industry breach      N=602 breached orgs; global cost
 S17                    Cost of a Data Breach Report 2026                                                                                Global breached-org sample.
                                                                study                                and AI attack context

                                                                IBM / Ponemon · Industry breach      AI oversight gap among incident-    Global; affected-organization
 S18                    Cost of a Data Breach Report 2025
                                                                study                                reporting orgs                      context.

                        NJ Bureau of Securities 2026            NJ Office of Attorney General ·      Nearly 800 NJ RIAs; AI +
 S19                                                                                                                                     Exam results not public.
                        Investment Adviser Examination          State regulatory primary             cybersecurity questions

                                                                New Jersey Legislature · State law   Data minimization, security,        Applicability depends on legal
 S20                    P.L. 2023, c.266
                                                                primary                              privacy obligations                 definitions/exemptions.

                                                                New Jersey Legislature · State law   Privacy-law amendments incl.
 S21                    P.L. 2026, c.25                                                                                                  Legal interpretation outside scope.
                                                                primary                              sensitive data

                        Enzo Biochem multistate data-           NJ Office of Attorney General ·      2.4M patients; ~331.6K NJ;
 S22                                                                                                                                     Case-specific; not prevalence.
                        security settlement                     State enforcement primary            required controls

                        Morgan Stanley data-security            NJ Office of Attorney General ·      Vendor/disposal risk; NJ affected
 S23                                                                                                                                     Case-specific.
                        settlement                              State enforcement primary            population

                                                                NJ Office of Attorney General ·      MFA/security program
 S24                    Weichert cybersecurity settlement                                                                                Historical case-specific.
                                                                State enforcement primary            remediation

                        An Examination of Artificial
                                                                NJ State Policy Lab / Rutgers ·      NJ small-business AI needs
 S25                    Intelligence and Small Businesses                                                                                Study project/qualitative focus.
                                                                Academic/policy prior art            research
                        in New Jersey

                        The Voices of Small Business            NJ State Policy Lab / Heldrich ·     Focus-group progress / small-
 S26                                                                                                                                     Localized qualitative sample.
                        Owners in Middlesex County              Academic/policy prior art            business AI experience

                        CEO Message / company                   Blueclone Networks · Company-        Milan Baria role/history/sector
 S27                                                                                                                                     Company-provided biography.
                        background                              provided context                     focus

                                                                Clutch · Third-party business        Legal entity verification; 10       Commercial review platform; not
 S28                    Blueclone Networks profile
                                                                profile                              verified reviews                    research evidence.
52Evidence ledgerChapter 7 · source page 52+
Evidence ledger
Each headline claim has a traceable support path and a visible boundary.

                                                                                                          Confidence /
 Claim                        Source    Class              Period             Method
                                                                                                          boundary

                                                                                                          High, provenance caveat ·
                                                                                                          Direct Census cell should
 NJ current AI use = 18.5%;                                                   Secondary extraction of
                              S4        Observed           May 2026                                       replace secondary
 planned = 20.5%                                                              Census BTOS state table
                                                                                                          extraction in final data
                                                                                                          archive.

 U.S. current AI use =                                                                                    High · Question definition
                              S2        Observed           May 3, 2026        Census published analysis
 19.8%                                                                                                    changed Nov. 2025.

                                                                                                          High · National sectors,
 Info 39.7%; finance 33.9%    S2        Observed           May 3, 2026        Census published analysis
                                                                                                          not NJ sectors.

 Regional
                                                                                                          High · NY + Northern NJ
 service/manufacturing AI     S5        Observed           Aug. 2026          NY Fed regional survey
                                                                                                          region.
 use = 61%/51%

 Third District current AI                                                    Weighted SBCS regional      High · DE/NJ/PA; not state-
                              S6        Observed           Fall 2025
 use = 37%                                                                    module                      specific.

 25% of AI users cite data
                                                                              Challenge question          High · Regional; question
 security/privacy             S6        Observed           Fall 2025
                                                                              among AI users              denominator = AI users.
 challenge

 NJCCIC incidents = 954;                                                      State threat-assessment     High · Reported incidents;
                              S8        Observed           2025
 +92%                                                                         operational reports         underreporting.

 Breach reports = 1,951;                                                      Initial breach reports      High · Not unique NJ
                              S8        Observed           2025
 ransomware 813                                                               affecting NJ residents      businesses.

 Credential notifications =                                                                               High · Notifications ≠
                              S8        Observed           2025               NJCCIC notifications
 94,168; +235%                                                                                            unique people/events.

 NJ IC3 complaints =                                                                                      High · Complaint data; not
                              S9        Observed           2025               FBI state table
 20,648                                                                                                   business-only.

 NJ IC3 losses = $660.4M;
                              S9        Observed           2025               FBI state loss table        High · Reported loss only.
 rank 5

 NJ complaints +31.5%;                                                                                    High · Aggregate
                              S9,S10    Derived            2024→2025          Simple arithmetic
 loss +51.9%                                                                                              composition may change.

 Verizon vulnerability                                                                                    High · Global breach
                              S14       Observed           2026 DBIR period   Incident corpus
 initial access = 31%                                                                                     corpus.

 Sophos identity breach =                                                     N=5,000 multinational       High · Not NJ
                              S15       Observed           2026
 71%                                                                          survey                      representative.

 IBM global average                                                           N=602 breached              High · Do not localize to
                              S17       Observed           2026
 breach cost = $4.99M                                                         organizations               NJ SMB.

 Statewide NJ AI                                                              No matched public           Unknown · Requires
                              —         Unknown            Current
 governance gap                                                               denominator                 telemetry/survey.
53Research trace: what was searched, used, and rejectedChapter 7 · source page 53+
Research trace: what was searched, used, and rejected
Reproducibility includes documenting evidence gaps and sources that were not fit for the claim.

 Category                                  What was examined                                  Decision

                                           Census BTOS releases,                              Used as adoption backbone; state NJ cell
 Official adoption                         methodology/instrument, state/sector/size          retained with secondary-extraction
                                           outputs                                            provenance.

                                           NY Fed regional business surveys; Philadelphia     Used for regional trend, adoption depth and AI
 Federal Reserve
                                           Fed SBCS                                           security/privacy concern.

                                           2026 Statewide Threat Assessment / NJCCIC          Used for NJ incidents, breach reports and
 NJ government threat data
                                           metrics                                            credentials.

                                                                                              Used for NJ complaint/loss trend and national
 Federal cybercrime                        FBI IC3 2024–2025 reports
                                                                                              AI-related descriptor.

                                                                                              Used to define measurable control domains; not
 Frameworks                                NIST CSF 2.0; AI/Cyber AI guidance
                                                                                              prevalence.

                                                                                              Used as context and control priorities; not NJ
 Industry studies                          Verizon, Sophos, IBM
                                                                                              estimates.

                                                                                              Used to show expectations/consequence; not
 State regulation/enforcement              Bureau of Securities, privacy statutes, AG cases
                                                                                              control prevalence.

 NJ prior art                              Rutgers/Heldrich NJ small-business AI research     Used to define originality boundary.

                                           Company background and public third-party
 Blueclone materials                                                                          Used only for leadership/entity context.
                                           profile

                                           MFA/DLP/patch/recovery/customer control            NOT AVAILABLE in supplied materials; no
 Blueclone telemetry
                                           exports                                            customer findings invented.

  Important rejected uses
  Older Census AI percentages were rejected as a continuous comparator because the question changed. Global vendor
  percentages were rejected as New Jersey prevalence estimates. IC3 loss averages were rejected as typical business-breach
  costs. Incident counts were rejected as unique-company denominators.

Sources: S1–S28 · project method S31
54Limitations & claim boundariesChapter 7 · source page 54+
Limitations & claim boundaries
The report is strongest when its unknowns are as explicit as its findings.
New Jersey state adoption provenance: the 18.5% / 20.5% cells are taken from a published LendingTree extraction of the
official Census BTOS data rather than a direct machine-readable Census cell in this research environment.
No matched control denominator: public evidence does not measure AI adoption and security-control maturity in the
same NJ businesses.
Regional surveys: NY Fed covers New York and Northern New Jersey; Philadelphia Fed AI module covers the Third
District. Neither is a state-only NJ AI/security estimate.
Reporting bias: NJCCIC and IC3 rely on reported incidents/complaints; actual cyber activity is not fully observed.
Population mismatch: Verizon incidents, Sophos surveys and IBM breached organizations differ from the NJ employer-
business population.
Selection bias: future Blueclone telemetry would represent managed/assessed organizations, not automatically all NJ
businesses.
Observation bias: a control can only be scored if observable; missing telemetry must stay unknown rather than silently
become failure.
Account vs organization denominators: high account-level MFA coverage can coexist with many organizations having at
least one unprotected critical service.
Temporal alignment: adoption, incident and control data must be aligned to a defined observation window before trend
claims are made.
Legal scope: statutory summaries are research context and not legal advice.
Causality: the study describes adoption, risks and control gaps; it does not establish that AI causes breaches without a
stronger longitudinal or experimental design.
Publication boundary
The most important unsupported sentence remains: “AI adoption is outrunning security in New Jersey businesses.” Until
matched controls are measured, the correct language is that the evidence makes the hypothesis serious, measurable and
timely—but not yet proven statewide.
Sources: S1 · S4 · S5 · S6 · S8 · S9 · S14 · S15 · S17
55About the research leadership & research teamChapter 7 · source page 55+
About the research leadership & research team
Credentials are context; evidence and reproducibility remain the basis for the report.

  Milan Baria · Founder & CEO, Blueclone Networks
  Blueclone’s public company materials identify Milan Baria as founder and CEO and state that he founded the firm in 2006
  after enterprise IT work in pharmaceutical and healthcare settings. Blueclone describes its focus as managed IT,
  cybersecurity, compliance, Microsoft 365, cloud and related services, with particular experience in regulated or security-
  conscious sectors. [S27]

  Independent company verification
  Clutch’s current profile lists Blueclone Networks, LLC as a New Jersey entity formed May 15, 2006, active, headquartered
  in Princeton, and Premier Verified. The profile showed 10 verified reviews averaging 5.0 at its July 22, 2026 update. This is
  organization-level third-party context, not validation of the findings in this report. [S28]

  Research methodology
  This report follows the supplied Research Execution Protocol: primary/raw sources first, explicit evidence classes,
  denominator discipline, source/evidence ledgers, prior-art review, contradictory-evidence search, reproducible
  calculations, and visible publication boundaries. The attached 24-page initial report and research-selection dashboard
  were treated as starting briefs; the 32-page NytroSEO report was used as a structural design reference, not as evidence for
  the NJ AI/security findings. [S29][S30][S31][S32]

  BOTTOM LINE
  New Jersey businesses are adopting AI at material scale, with much faster uptake in some regional and knowledge-
  intensive cohorts. At the same time, cyber incident reports, credential exposure, reported losses and regulatory attention
  are substantial. What remains unmeasured is the decisive denominator: among the same NJ organizations using AI, how
  many have complete policy, identity, data, vendor, patching, monitoring and recovery controls? That is the next
  publishable study.

Sources: S27 · S28 · supplied files: S29–S32
56Direct source references & project materialsChapter 7 · source page 56+
Direct source references & project materials
URLs and attached-file provenance for reproducibility.

S1 · Business Trends and Outlook Survey Data Release — May 7, 2026
https://www.census.gov/newsroom/press-releases/2026/btos-may-7.html
S2 · Large Firms With at Least 20 Employees Biggest AI Users
https://www.census.gov/library/stories/2026/05/ai-use-businesses.html
S3 · BTOS AI Supplement Questionnaire
https://www2.census.gov/data/experimental-data-products/business-trends-and-outlook-survey/questionnaire-ai-supplement.pdf
S4 · Big Companies Are Racing Ahead on AI — but Few Are Cutting Jobs
https://www.lendingtree.com/business/small/ai-business-study/
S5 · Businesses Are Using AI to Transform Work, Not Cut Jobs
https://libertystreeteconomics.newyorkfed.org/2026/09/businesses-are-using-ai-to-transform-work-not-cut-jobs/
S6 · Small Business Credit Survey: 2026 Insights into the Third District Region
https://www.philadelphiafed.org/community-development/credit-and-capital/small-business-credit-survey-2026-insights-into-the-third-district-region
S7 · QuickFacts: New Jersey
https://www.census.gov/quickfacts/fact/table/NJ/SBO030222
S8 · 2026 New Jersey Statewide Threat Assessment
https://cdn-assets.fedwebplatform.org/fed-110/2/2026_NJ_Threat_Assessment.pdf
S9 · 2025 IC3 Annual Report
https://www.ic3.gov/AnnualReport/Reports/2025_IC3Report.pdf
S10 · 2024 IC3 Annual Report
https://www.ic3.gov/AnnualReport/Reports/2024_IC3Report.pdf
S11 · Cybersecurity Framework 2.0
https://www.nist.gov/cyberframework
S12 · Cybersecurity Framework Profile for Artificial Intelligence (Cyber AI Profile), preliminary draft
https://csrc.nist.gov/pubs/ir/8596/iprd
S13 · AI Risk Management Framework: Generative AI Profile
https://doi.org/10.6028/NIST.AI.600-1
S14 · 2026 Data Breach Investigations Report
https://www.verizon.com/business/resources/reports/dbir/
S15 · State of Identity Security 2026
https://www.sophos.com/en-us/blog/sophos-state-of-identity-security-2026
S16 · State of Ransomware 2026
https://www.sophos.com/en-us/content/state-of-ransomware
S17 · Cost of a Data Breach Report 2026
https://www.ibm.com/reports/data-breach
S18 · Cost of a Data Breach Report 2025
https://www.ibm.com/reports/data-breach
S19 · NJ Bureau of Securities 2026 Investment Adviser Examination
https://www.njoag.gov/new-jersey-bureau-of-securities-annual-examination-of-investment-advisers-will-look-closely-at-ai-and-cybersecurity/
S20 · P.L. 2023, c.266
https://pub.njleg.gov/Bills/2022/PL23/266_.HTM
S21 · P.L. 2026, c.25
https://pub.njleg.gov/Bills/2026/AL26/25_.HTM
S22 · Enzo Biochem multistate data-security settlement
https://www.njoag.gov/attorney-general-platkin-and-multistate-coalition-secure-4-5-million-from-enzo-biochem-for-failing-to-protect-health-data/
S23 · Morgan Stanley data-security settlement
https://www.njoag.gov/ag-platkin-new-jersey-to-receive-1-27-million-in-multistate-settlement-with-morgan-stanley-over-data-security-incidents-that-compromised-personal-
information-of-millions-of-individuals-nationwide/
S24 · Weichert cybersecurity settlement
https://www.njoag.gov/acting-ag-platkin-reaches-settlement-with-real-estate-and-financial-group-over-data-breach-and-inadequate-cybersecurity-measures/
S25 · An Examination of Artificial Intelligence and Small Businesses in New Jersey
https://policylab.rutgers.edu/publication/an-examination-of-artificial-intelligence-and-small-businesses-in-new-jersey/
S26 · The Voices of Small Business Owners in Middlesex County
https://policylab.rutgers.edu/publication/the-voices-of-small-business-owners-in-middlesex-county/
S27 · CEO Message / company background
https://www.blueclone.com/ceo-message/
S28 · Blueclone Networks profile
https://clutch.co/profile/blueclone-networks
S29–S32 · Project materials supplied with this project: initial selected-topic research brief; validated research-selection dashboard; Research Execution Protocol;
NytroSEO 170M+ URL report used only as a structural design reference.
Chapter 1 · Executive Findings & Evidence Model
Page 1 · Is AI Adoption Outrunning Security in New Jersey Businesses?
BLUECLONE RESEARCH · NEW JERSEY Is AI Adoption Outrunning Security in New Jersey Businesses? A 2025–2026 evidence synthesis of business AI adoption, cybersecurity incidents, breach exposure, regulatory expectations, and the missing governance benchmark 18.5% 954 1,951 $660.4M NJ businesses using AI NJCCIC incident reports NJ breach reports NJ IC3 reported losses Secondary extraction of Census 2025 · +92% vs 2024 2025 · affecting NJ residents 2025 · 5th-highest state total BTOS, May 2026 EVIDENCE-PROPORTIONAL CONCLUSION CORE FINDING AI adoption is materially present and accelerating in important New Jersey business segments while cyber incidents, credential exposure, reported losses, and regulatory scrutiny are simultaneously high. However, no public statewide dataset measures AI adoption and security-control maturity in the same New Jersey businesses. The defensible conclusion is a rising exposure surface plus a measurable governance-data gap—not a fabricated statewide “AI security gap” percentage. Evidence summary. Census-based state data place New Jersey business AI use at 18.5% in the May 2026 release, while regional Federal Reserve surveys show much higher use in service, manufacturing, and knowledge-intensive firms. NJCCIC, FBI IC3, and state enforcement evidence show substantial cyber pressure. Security/privacy already appears as an AI adoption concern in regional small-business evidence. These datasets are complementary, not interchangeable: none alone proves that the same AI-using NJ firms lack adequate controls. [S1][S4][S5][S6][S8][S9] Research period Evidence refresh Research lead Target audience Status NJ businesses · journalists · Public-evidence full Milan Baria · Founder & 2024–Sep 2026 Sep. 21, 2026 analysts · regulators · research · matched-control CEO, Blueclone Networks IT/security leaders study proposed Sources: S1 · S4 · S5 · S6 · S8 · S9
Page 2 · Research leadership & report map
Research leadership & report map The report opens with evidence, not marketing; full source and leadership notes appear at the end. RESEARCH LEADERSHIP Milan Baria · Founder & CEO, Blueclone Networks Blueclone’s company materials identify Milan Baria as founder and CEO and describe prior enterprise IT work in pharmaceutical and healthcare environments before founding the company in 2006. A current Clutch profile independently verifies Blueclone Networks, LLC as an active New Jersey business formed in 2006 and shows a Premier Verified profile with 10 verified reviews. These credentials provide industry context; they are not evidence for the statistical findings in this report. [S27][S28] Pages Section Purpose Executive findings, evidence model, NJ 3–8 Define the problem and denominators. business landscape State, national, size, sector and regional 9–18 AI adoption analysis evidence. Controls, incidents, credentials, cybercrime 19–30 Security, governance and threat analysis and global benchmarks. New Jersey regulation and sector Financial services, privacy law, 31–37 implications enforcement, healthcare, legal/professional. Synthesis, answer, null findings, prior art, Separate what is observed from what 38–43 red-team remains unknown. Methodology, matched study, data 44–49 Make the next test reproducible. dictionary, publication package Source ledger, evidence ledger, research 50–55 Trace every material claim. trace, limitations, team Research principle Make the claim no larger than the evidence—and make the methodology clear enough for another analyst to reproduce it. Sources: S27 · S28 · S31
Page 3 · Executive findings
Executive findings The evidence supports a serious security-readiness question, but not a statewide causal verdict. 18.5% 20.5% 25% 94,168 NJ current AI use NJ expected AI use AI-using Third District firms NJCCIC credential May 2026 Census-based state Next six months [S4] citing data security/privacy notifications extraction [S4] Regional small-business sample; not 2025; +235% year over year [S8] NJ-only [S6] FACT — Census BTOS provides state, industry and firm-size AI adoption estimates; its sample framework is approximately 1.2 million employer businesses divided across six panels, not 1.2 million completed AI responses. [S1] OBSERVED — A published extraction of the official May 2026 BTOS release reports 18.5% of New Jersey businesses using AI in the prior two weeks and 20.5% expecting to use it in the next six months. [S4] OBSERVED — New York Fed regional surveys covering New York and Northern New Jersey show 61% AI use among service firms and 51% among manufacturers in 2026, up sharply from 2024. [S5] OBSERVED — NJCCIC received 954 cyber incident reports in 2025, up 92%, and issued 94,168 compromised-credential notifications, up 235%. [S8] OBSERVED — FBI IC3 received 20,648 New Jersey complaints in 2025 with $660.4 million in reported losses; the loss total ranked fifth among states. [S9] UNKNOWN — No public dataset reviewed provides a matched NJ business denominator for approved AI policy, complete MFA coverage, DLP, managed/private AI, tested recovery, patch latency, and incident monitoring among the same AI adopters. Bottom line New Jersey has crossed the threshold where AI governance and cyber controls should be measured together. The evidence supports urgency and a matched-control research program; it does not support claiming that a specific share of NJ AI adopters is insecure without new organization-level data. Sources: S1 · S4 · S5 · S6 · S8 · S9
Page 4 · Research summary data
Research summary data Each dataset answers a different part of the research question. Evidence layer Dataset / scale Unit / denominator Role Key limitation Exact NJ cell used here is Census BTOS · ~1.2M- Weighted employer State/sector/size adoption from a published Adoption business sample businesses responding to benchmark secondary extraction of framework each question Census data. Regional businesses in NY Trend and sector Not a New Jersey-only Regional adoption NY Fed business surveys & Northern NJ concentration estimate. Fed SBCS · 894 Third Weighted firms; AI module AI use + adoption AI module not state- Small-business adoption District small employers regional challenges specific at publication. Voluntary/operational Reported cybersecurity NJ incidents NJCCIC 2025 · 954 reports Threat environment reporting; not incidence incidents census. Organizations may be NJCCIC · 1,951 initial Data breach reports outside NJ; affected NJ breach notices Consequence surface reports affecting NJ residents residents are not business denominators. Individuals and FBI IC3 · 20,648 NJ Complaints with state organizations; Cybercrime Reported loss context complaints information underreporting; not business-only. Frameworks, incidents, NIST / Verizon / Sophos / Control priorities and Different populations; no Control context surveys, breached IBM external benchmarks direct NJ prevalence. organizations Scale discipline The report never treats survey sample frames, completed responses, businesses represented, cyber events, breach notices, user accounts, or affected people as interchangeable. Cross-dataset comparisons are descriptive unless a common denominator exists. Sources: S1 · S5 · S6 · S8 · S9 · S11 · S14 · S15 · S16 · S17
Page 5 · Evidence model & claim discipline
Evidence model & claim discipline Five labels are used to prevent hypotheses from becoming headlines. Label Meaning Example in this report Directly supported by authoritative BTOS publishes AI adoption by state, FACT documentation. industry and firm size. [S1] Directly reported in a cited NJCCIC received 954 incident reports in OBSERVED dataset/publication. 2025. [S8] Arithmetic calculated from sourced NJ IC3 complaints rose 31.5% from 2024 DERIVED figures. to 2025. [S9][S10] Higher AI use in information/finance Evidence-grounded interpretation, not INFERENCE makes governance measurement directly measured. especially consequential. AI adopters are less likely than needed to HYPOTHESIS A proposition requiring matched data. have complete control coverage. Statewide share of NJ AI adopters with UNKNOWN Evidence is insufficient. approved AI policy + complete MFA + DLP. The central discipline A 20% AI-adoption rate minus a 15% security-control rate from a different sample does not equal a 5-point governance gap. The study therefore refuses to manufacture a single “gap” statistic from unmatched datasets. No correlation is presented as causation. Industry surveys remain labeled by vendor, geography, and respondent population. Global breach-cost means are not localized to a typical NJ SMB. State incident counts are not used as business-prevalence estimates. AI adoption before and after the November 2025 Census question change is not plotted as a continuous series. Sources: S1 · S2 · S31
Page 6 · What would “AI adoption outrunning security” actually
What would “AI adoption outrunning security” actually mean? The phrase requires matched measurement, not rhetorical juxtaposition. A defensible test requires observing AI adoption and required controls within the same organization cohort, ideally at the same time. The core unit of analysis should be an employer organization or tenant—not an incident, user account, device, breach notification, or employee. Construct Operational measure Preferred denominator Current business use of AI in any business AI adoption Employer organizations assessed function Approved policy, approved-tool inventory, AI governance AI-adopting organizations assessed data rules, vendor review, output review Eligible identities protected by required Eligible accounts + organization-level Identity security MFA; privileged/NHI controls; risky-login completeness monitoring DLP/sensitivity coverage and controlled path In-scope users/workloads + organization- Data protection for sensitive data level completeness Endpoint / patch Critical patch latency, lifecycle exposure Managed endpoints / critical findings Backup coverage + verified restore test Recovery In-scope workloads + organizations within policy window PROPOSED DERIVED METRIC Preferred primary metric Governed AI Adoption Rate = AI adopters meeting all defined minimum controls ÷ AI adopters assessed. Governance Gap Rate = 1 − Governed AI Adoption Rate. The numerator and denominator must be published together. Sources: Method specification: S31 · control rationale: S11 · S12 · S14 · S15
Page 7 · New Jersey’s business base is large and heterogeneous
New Jersey’s business base is large and heterogeneous Statewide averages hide a wide range of firm sizes and risk profiles. 237,968 185,622 3.95M $292.1B Employer establishments Employer firms Total employment Annual payroll 2023 [S7] 2023 [S7] 2023 [S7] 2023 [S7] New Jersey is not one security environment. Healthcare, financial services, pharmaceuticals, legal services, manufacturing, logistics, retail, and professional services differ materially in data sensitivity, regulatory obligations, technology stacks, and attack surfaces. A statewide AI estimate is useful for scale, but the security question needs segmentation by industry and size. Research implication The final matched study should publish statewide results only when weighting and sample design justify them. Otherwise, findings should be described as the assessed Blueclone/NJ business sample and broken out into sufficiently large sector and size cells. Size bands should align with Census categories when possible to facilitate benchmarking. Industry should use 2- or 3-digit NAICS where sample size permits. Very small cells should be combined or suppressed to protect privacy and avoid unstable percentages. Multi-state operations require explicit geography rules; Census state estimates do not simply count every company with any NJ establishment. Sources: S7 · S1
Page 8 · Data architecture: four evidence layers
Data architecture: four evidence layers The report keeps adoption, controls, threats and impact separate until a valid join is possible. Layer Best current source What it measures Can it prove the NJ gap? Who uses AI, by 1 · Adoption Census BTOS; Fed surveys Only the adoption side. geography/sector/size NIST benchmark; proposed NJ Policy, MFA, DLP, patching, Yes, once measured in the 2 · Controls telemetry/survey recovery, monitoring same adopters. Incidents, access paths, Shows pressure, not adopter 3 · Threats NJCCIC; FBI; Verizon; Sophos ransomware, credentials control maturity. Reported losses, breach costs, Shows consequence, not AI 4 · Impact IC3; IBM; NJ enforcement regulatory consequences causation. Why this matters Without the control layer, the question remains partly unobserved. That missing layer is the research white space: Census measures adoption; NJCCIC/FBI measure risk outcomes; regulators define expectations; a privacy-preserving operational dataset can measure whether the controls behind adoption actually exist. Sources: S1 · S8 · S9 · S11 · S14 · S16 · S19 · S31
Chapter 2 · AI Adoption Analysis
Page 9 · Census BTOS: denominator discipline
Census BTOS: denominator discipline The 1.2-million-business figure is a sample framework, not a response count. ~1.2M 6 Nov 17–Feb 8 Biweekly Employer-business sample Rotating panels 2026 AI supplement collection Core BTOS cadence framework ~200K businesses each [S1] 2025–2026 [S1] Current business conditions [S1] BTOS [S1] Census states that the AI supplement supports differences by industry, geography (including states), and firm size. Estimates use survey weighting and responding businesses; the sample framework should never be described as 1.2 million completed AI questionnaires. [S1] Unit: employer business, excluding farms under the BTOS design. Published percentages are weighted estimates, not raw share of the 1.2 million sample frame. Question-specific response denominators can differ. State assignment has special treatment for businesses with establishments in multiple states; state output is not literally every employer with an NJ footprint. Uncertainty measures and suppression/reliability flags should accompany state and subgroup estimates when extracted from the official tables. Publication-safe wording “The Census BTOS draws from an approximately 1.2-million-business sample framework.” Do not say “1.2 million businesses responded to the AI survey.” Sources: S1 · S3
Page 10 · The November 2025 AI-definition break changes the story
The November 2025 AI-definition break changes the story Older and newer Census AI-use percentages are not directly comparable. EARLIER SERIES Before November 2025 Census asked whether businesses used AI in producing goods or services. CURRENT SERIES From November 2025 The question broadened to whether businesses used AI in any business function, which captures activities such as drafting, research, administrative work and other functions beyond production. This definition change is analytically material. A chart that connects 2023–2024 percentages to 2026 without a visible series break can create a false impression of adoption acceleration. The report therefore uses the current-definition 2026 series for its main adoption baseline. [S2][S3] Safe comparison Unsafe comparison Compare states/sectors/sizes within the same current-definition Treat 2024 and 2026 AI-use levels as one continuous time series. period. Use NY Fed’s own consistent 2024–2026 regional question for Mix NY Fed regional rates with Census state rates as though the regional trend. populations/questions match. Label expected-use rates separately from current-use rates. Add current + planned percentages together. Sources: S2 · S3 · S5
Page 11 · New Jersey’s 2026 AI adoption benchmark
New Jersey’s 2026 AI adoption benchmark The best public state estimate available in this research pass is 18.5% current use. Observed percentages from a published LendingTree extraction of U.S. Census BTOS May 2026 state/national data. Current use = past two weeks; planned = expected use next six months. State cell provenance is secondary extraction of official Census data. [S4] OBSERVED — LendingTree’s June 15 analysis of the U.S. Census BTOS reports New Jersey at 18.5% current AI use and 20.5% expected use in the next six months. The corresponding U.S. values were 19.8% and 22.8%. [S4] DERIVED Derived comparison New Jersey’s current estimate is 1.3 percentage points below the U.S. rate (about 6.6% lower on a relative basis). NJ expected use is 2.0 points above current use, a 10.8% relative increase if expectations were realized. These calculations are arithmetic—not forecasts. Provenance note The exact New Jersey cell was not independently machine-extracted from Census’s downloadable XLSX/API in this environment. For publication, retain the attribution to LendingTree’s Census analysis or replace it with the direct Census state cell after an independent extraction. Sources: S1 · S4
Page 12 · National baseline: AI has moved beyond a fringe behavior
National baseline: AI has moved beyond a fringe behavior Nearly one in five U.S. employer businesses reported current use in May 2026. 19.8% 20–23% 17–20% 37% U.S. current AI use Expected use range Current-use range 250+ employees May 3, 2026 [S2] Dec 2025–May 2026 [S2] Dec 2025–May 2026 [S2] May 3, 2026 [S2] Census reviewed six months of BTOS data from December 14, 2025 through May 3, 2026. Overall U.S. AI usage generally ranged from 17% to 20%, while expected use generally ranged from 20% to 23%. [S2] Interpretation: adoption is material but far from universal. The national figure is a business-level estimate; it does not mean 19.8% of employees use AI or 19.8% of business tasks are AI-assisted. Expected use is an intention measure, not observed future adoption. The broader current-definition question makes this series useful for present benchmarking but not naïve year-over-year comparison with the old question. Research implication A statewide NJ governance study no longer asks whether AI is rare enough to ignore. It asks whether businesses that have already adopted—or expect to adopt—have adequate controls in place before use expands further. Sources: S2
Page 13 · Firm size is one of the strongest adoption gradients
Firm size is one of the strongest adoption gradients Larger businesses are materially further into AI use. Observed U.S. current AI use by employee-size band from Census-based May 2026 data. [S4] OBSERVED — Current AI use rises from roughly 19% among 1–4 employee businesses to 37.3% among businesses with 250+ employees. Businesses with 100–249 employees were at 32.0%. [S4] DERIVED Derived relative rates The 250+ rate is about 1.88× the overall U.S. 19.8% rate; the 100–249 rate is about 1.62×. [S2][S4] This gradient is important for security research because larger organizations often have more complex identity estates, vendor relationships, data flows, and application portfolios. It does not follow that they are less secure; they may also have stronger security programs. The study must measure both exposure and control maturity rather than assuming one from size. Sources: S2 · S4
Page 14 · Sector differences are even larger
Sector differences are even larger Information and finance/insurance are already well above the national adoption rate. Observed U.S. current AI use in selected sectors, May 2026. National overall = 19.8%. [S2][S4] DERIVED Derived contrast Information-sector use at 39.7% is about 2.0× the overall U.S. rate; finance and insurance at 33.9% is about 1.71×. [S2] The sector pattern argues against one statewide headline as the entire story. Knowledge-intensive sectors have already crossed much further into adoption, while retail and construction remain lower. That changes where a New Jersey security-control study is most likely to find enough AI adopters for meaningful subgroup analysis. First-wave cohorts: information, professional/scientific/technical services, finance/insurance, education. Regulated-sector importance: healthcare and finance combine material adoption with sensitive data and compliance obligations. Comparison group: lower-adoption sectors help test whether control maturity tracks adoption rather than sector alone. Sources: S2 · S4
Page 15 · Northern New Jersey’s regional signal is much faster
Northern New Jersey’s regional signal is much faster Federal Reserve regional surveys show sharp 2024–2026 growth. Observed business AI use in New York Fed regional surveys covering New York and Northern New Jersey. Services: 25% (2024), 40% (2025), 61% (2026). Manufacturing: 16%, 26%, 51%. Regional—not NJ-only. [S5] OBSERVED — In August 2026, 61% of service firms and 51% of manufacturers in the New York–Northern New Jersey regional business surveys reported using AI as part of business processes in the prior six months. Knowledge-intensive sectors such as information, business services, and finance had the highest usage. [S5] Do not misuse this number 61% is not a statewide New Jersey adoption estimate. The New York Fed survey is a regional business survey covering New York and Northern New Jersey and uses its own question, timing and sample. Its value here is trend and sector context. Sources: S5
Page 16 · Adoption breadth is rising faster than adoption depth
Adoption breadth is rising faster than adoption depth Widespread AI use does not necessarily mean deep operational dependence. 61% 51% 17% 7% Regional service firms using Regional manufacturers using Median workers using AI at Median workers using AI at AI AI adopting service firms adopting manufacturers NY/Northern NJ [S5] NY/Northern NJ [S5] [S5] [S5] The same New York Fed research reports that AI investment remained modest for most adopters. About three-quarters of service firms and more than 90% of manufacturers characterized their AI investment as minimal or modest. Only around 15% of service firms reported significant investment and roughly 5% major strategic investment. [S5] OBSERVED + INFERENCE Unexpected finding AI can be widespread at the firm level while still touching a minority of workers inside each firm. This matters for security measurement: a simple “uses AI” flag can conceal whether AI is one employee’s drafting tool, a company-wide copiloting platform, or an agentic system with production permissions. A mature governance study should therefore capture intensity: number of approved AI tools, percent of workforce with access, whether sensitive data are allowed, presence of external connectors, whether AI agents act with delegated credentials, and whether the organization uses public, enterprise, private, or managed AI paths. Sources: S5
Page 17 · Third District small businesses: adoption is material but
Third District small businesses: adoption is material but lower than nationally A weighted regional sample gives the closest public small-business adoption/security bridge. Observed weighted Third District estimates from the 2025 Small Business Credit Survey. N=894 small employer firms across Delaware, New Jersey and Pennsylvania. AI results were available only regionally at publication. [S6] OBSERVED — The Philadelphia Fed reports 37% of Third District small employer firms were currently using AI, compared with 46% nationally. Another 45% had no current use and no plans, 13% planned adoption within 12 months, and 5% were unsure. [S6] Population boundary These are firms with 1–499 employees across Delaware, New Jersey and Pennsylvania. The article explicitly says the AI- module results were only available regionally at the time of writing. The 37% figure cannot be relabeled “New Jersey small businesses.” The SBCS weighting uses variables including firm age, employment size, owner demographics and industry to reflect each geography. That makes it valuable regional evidence, but still a different instrument and population from Census BTOS. [S6] Sources: S6
Page 18 · Security and privacy are already part of the AI adoption
Security and privacy are already part of the AI adoption decision The regional small-business survey directly connects AI use with control concerns. Observed shares citing data security/privacy: 25% among current AI users answering challenge question; 14% among firms with no plans to adopt answering reasons question. Different denominators; not a direct risk comparison. [S6] OBSERVED — Among the 37% of Third District firms already using AI, 25% cited data security and privacy as a challenge. Among the 45% with no plans to use AI, 14% cited data security and privacy as a reason. [S6] Critical denominator note The 25% and 14% values come from different question populations. They should not be subtracted to claim an 11-point “security gap.” What they show is that security/privacy is salient both after adoption and among some nonadopters. The New York Fed offers a parallel qualitative signal: among regional nonadopters, more than one-third cited data privacy, security, or confidentiality concerns, alongside similar concerns about accuracy and skill gaps. [S5] Sources: S5 · S6
Chapter 3 · Security, Governance & Threat Analysis
Page 19 · A security benchmark needs a defined control standard
A security benchmark needs a defined control standard NIST CSF 2.0 provides the cross-sector structure; AI-specific guidance adds the AI layer. Control domain NIST-aligned research question AI-specific relevance Are AI use, risk ownership, policies and Approved tools, accountability, AI risk Govern vendors governed? decisions. Are AI systems, data flows, identities and Shadow AI, connectors, models, agents, Identify assets inventoried? sensitive data. Are identities, endpoints and data MFA, least privilege, DLP, encryption, Protect protected? training. Can misuse, risky sign-ins and abnormal Detect Monitoring, SIEM, model/app telemetry. AI/data activity be detected? Can the organization contain AI-enabled or Escalation, IR playbooks, vendor Respond AI-related incidents? coordination. Recover Are backups and restore procedures tested? Resilience independent of attack vector. NIST CSF 2.0 is designed for organizations across sectors and sizes and adds a stronger governance focus. NIST’s Cyber AI Profile work explicitly addresses managing cybersecurity risks related to AI systems and using AI to enhance cyber defense. [S11][S12] Research use, not certification This report uses NIST as a measurement scaffold. It does not claim that any NJ business is “NIST compliant” unless a formal assessment supports that statement. Sources: S11 · S12 · S13
Page 20 · Minimum viable AI-governance control set
Minimum viable AI-governance control set A small number of observable controls can support a clear headline metric. Control Organization-level pass rule Why it matters Approved/current policy defines permitted use Approved AI policy Turns informal use into governed use. and data classes Approved-tool inventory and managed/private Approved AI path Reduces shadow-AI ambiguity. enterprise path where needed All eligible human and privileged identities Partial deployment can conceal exposed Complete MFA covered; exceptions documented services. DLP/sensitivity controls cover in-scope Data protection users/workloads or equivalent documented AI increases pathways for data movement. controls AI vendors/connectors assessed before sensitive Vendor review Third-party risk is material. use Critical exposure and unsupported OS Vulnerabilities are a leading breach entry Patch/endpoint baseline measured and remediated point. Tested recovery Recent restore test with outcome recorded Prevention can fail; recovery must be proven. Risky login/identity and relevant AI/data events Monitoring Controls need detection, not merely policy. observable Recommended headline metric Report the share of AI adopters that meet all four minimum controls—approved AI policy, complete MFA, data-protection coverage, and approved/managed AI path—then publish each component separately so the composite cannot hide the mechanism. Sources: S11 · S12 · S14 · S15
Page 21 · New Jersey cyber incident reports nearly doubled in 2025
New Jersey cyber incident reports nearly doubled in 2025 NJCCIC recorded 954 incident reports, with social engineering dominant. Observed NJCCIC cybersecurity incident reports by category, 2025. Total = 954. Information cutoff Dec. 31, 2025. [S8] OBSERVED — NJCCIC received 954 cybersecurity incident reports in 2025, a 92% increase from 2024. The largest category was social engineering (561), followed by unauthorized access/hacking (278) and ransomware (48). [S8] Interpretation boundary These are incident reports received by NJCCIC, not a census of all attacks against New Jersey businesses. Reporting behavior, program awareness, and classification changes can affect the count. The threat assessment itself notes that actual attacks are likely higher because not all incidents are reported. Sources: S8
Page 22 · Breach reporting shows a large ransomware and
Breach reporting shows a large ransomware and unauthorized-access burden NJCCIC received 1,951 initial breach reports affecting New Jersey residents in 2025. Observed NJCCIC initial data breach reports affecting NJ residents by reported cause, 2025. Total categories sum to 1,951. [S8] OBSERVED — Of 1,951 initial data breach reports affecting New Jersey residents, 813 were attributed to ransomware (42%), 676 to unauthorized access, 311 to social engineering, 92 to accidental exposure, 48 to insider theft, and a small number to other/device-media causes. [S8] Denominator discipline A breach report is not a New Jersey business. The organization reporting may be based elsewhere, one organization can experience more than one event, and the count does not identify whether AI was used by the victim or attacker. Its role is consequence context. Sources: S8
Page 23 · Credential exposure is a rapidly worsening New Jersey signal
Credential exposure is a rapidly worsening New Jersey signal NJCCIC issued 94,168 compromised-credential notifications in 2025. Observed NJCCIC compromised-credential notifications: 16,175 (2022), 26,951 (2023), 28,145 (2024), 94,168 (2025). [S8] DERIVED Derived change 94,168 notifications in 2025 represent a 234.6% increase over 28,145 in 2024—consistent with NJCCIC’s rounded +235% statement. [S8] NJCCIC explains that compromised credentials can enable unauthorized access while appearing as legitimate logins and reports that compromised credentials were used for initial access in the majority of ransomware incidents it analyzed among New Jersey victim organizations. It recommends password changes, unique passwords, password managers, MFA, and endpoint protection when credentials are exposed. [S8] For AI governance, identity matters twice: employees authenticate to AI applications, and agents/services may introduce non-human identities, API keys, service accounts and delegated permissions. A binary “MFA enabled” field is therefore insufficient; complete eligible-account coverage and privileged/NHI treatment are the stronger measures. Sources: S8 · S14 · S15
Page 24 · FBI IC3: New Jersey reported $660.4M in cybercrime losses in
FBI IC3: New Jersey reported $660.4M in cybercrime losses in 2025 The state ranked fifth by reported complaint loss. Observed New Jersey IC3 reported complaint losses: $434.9M in 2024 and $660.4M in 2025. [S9][S10] $660.4M 20,648 216.2 $31,984 2025 NJ reported loss 2025 NJ complaints Complaints per 100K Loss / complaint 5th among states [S9] 16th by count [S9] 2025 · rank 42 [S9] Derived; not average business loss Do not call this a business-loss average IC3 complaints include individuals and organizations and cover many crime types. The derived $31,984 is simply total reported NJ loss divided by NJ complaint count. It is not the cost of an average NJ business cyber incident. Sources: S9 · S10
Page 25 · New Jersey IC3 complaint count and losses both rose sharply
New Jersey IC3 complaint count and losses both rose sharply year over year The loss increase outpaced the complaint increase. Observed New Jersey IC3 complaints: 15,701 in 2024; 20,648 in 2025. [S9][S10] Metric 2024 2025 Derived change NJ complaints 15,701 20,648 +31.5% NJ reported losses $434.9M $660.4M +51.9% Loss per complaint $27,696 $31,984 +15.5% DERIVED — Reported losses grew faster than complaint volume from 2024 to 2025. This does not establish that attack severity increased for a typical business: case mix, high-value outliers, reporting behavior, crypto/investment fraud and who submitted complaints can all change the aggregate. [S9][S10] Use as pressure indicator IC3 is best used here to demonstrate the material financial scale of reported cyber-enabled crime touching New Jersey— not to estimate the prevalence or average cost of AI-related incidents among NJ businesses. Sources: S9 · S10
Page 26 · AI is now explicitly visible in national cybercrime reporting
AI is now explicitly visible in national cybercrime reporting FBI IC3 added an AI-related descriptor with substantial reported losses. 22,364 $893.3M >$30M 1.01M AI-related complaints Adjusted AI-related losses Business losses from AI- Total IC3 complaints U.S. 2025 [S9] U.S. 2025 [S9] involving BEC scams U.S. 2025 [S9] U.S. 2025 [S9] OBSERVED — IC3 reports 22,364 complaints with an AI-related descriptor and $893,346,472 in adjusted losses in 2025. It notes AI can be used to generate convincing synthetic content and states that businesses reported more than $30 million in losses to business-email-compromise scams involving AI. [S9] Classification boundary “AI related” is an IC3 descriptor, not a single crime type, and it does not mean AI caused the full loss. It identifies complaints reporting an AI nexus. These are national numbers, not New Jersey-specific. This is nevertheless relevant to the study: AI changes both the internal governance surface and the external threat environment. Controls must therefore address employee/tool use and adversarial use without conflating the two. Sources: S9
Page 27 · Verizon 2026: the external attack surface is shifting
Verizon 2026: the external attack surface is shifting Vulnerabilities, ransomware, third parties and shadow AI all matter to the control model. 31% 48% 48% 45% Breaches starting with Breaches involving Breaches with third-party Employee shadow-AI use software vulnerabilities ransomware involvement signal reported by Verizon 2026 DBIR [S14] 2026 DBIR [S14] 2026 DBIR [S14] Tripled from 15% [S14] Verizon’s 2026 DBIR analyzes more than 31,000 incidents, including more than 22,000 confirmed breaches across 145 countries. Its in-scope incidents ran from November 1, 2024 through October 31, 2025. [S14] Vulnerability exploitation reached 31% of breaches and became the leading initial-access route in Verizon’s analysis. Third-party involvement reached 48%, emphasizing supplier and connector governance. Verizon reports employee use of unapproved “shadow AI” tripled to 45%, a direct reason to measure approved-tool inventory and data controls. These are global/multi-source breach findings—not estimates of how many NJ businesses have each exposure. Control implication An AI-readiness benchmark that measures policy but ignores patching, third parties, identity and shadow-AI pathways would miss the mechanisms currently prominent in breach evidence. Sources: S14
Page 28 · Identity control maturity cannot be reduced to “MFA exists”
Identity control maturity cannot be reduced to “MFA exists” Sophos’ 2026 identity survey exposes visibility and coverage gaps. 5,000 71% 24% 3 IT/cybersecurity leaders Reported ≥1 identity-related Continuously monitor unusual Average identity attacks 17 countries · 14 industries [S15] breach login attempts among affected organizations Prior 12 months [S15] [S15] [S15] Sophos surveyed 5,000 IT and cybersecurity leaders in organizations across 17 countries and 14 industries. Seventy- one percent reported at least one identity-related breach in the previous year; only 24% continuously monitored unusual login attempts. Smaller organizations with 100–250 employees were reported as nearly twice as likely as midsized peers to fail to detect and stop their most significant identity attack before damage occurred. [S15] Population boundary This is a multinational vendor-commissioned survey of organizations, not a representative sample of New Jersey businesses. It is used to define what to measure—not to estimate NJ breach prevalence. The AI relevance is structural: cloud AI services, copilots and agents can add human accounts, service accounts, non- human identities, tokens and delegated permissions. A useful NJ benchmark must distinguish coverage by identity class. Sources: S15
Page 29 · Ransomware evidence reinforces the identity-coverage
Ransomware evidence reinforces the identity-coverage problem A victim-only sample shows why partial MFA can coexist with compromise. 2,158 79% 97% 56% Ransomware-hit organizations Attacks starting with identity- Credential-root-cause victims Attacks that encrypted data surveyed based approach with some MFA Victim sample [S16] 17 countries [S16] Victim sample [S16] Coverage gaps remained [S16] Sophos’ 2026 State of Ransomware survey included 2,158 IT/security leaders specifically at organizations that had experienced ransomware in the prior 12 months. Malicious email (26%), phishing (24%), compromised credentials (23%) and exploited vulnerabilities (18%) were leading cited root causes. [S16] Victim-only denominator These results cannot estimate the chance that a random NJ business will suffer ransomware. They describe attack paths and outcomes among organizations that were already ransomware victims. The 97% MFA statistic is especially useful for research design: “MFA enabled somewhere” is a weak control measure. The matched NJ study should calculate MFA-protected eligible accounts / all eligible accounts, separately for human, privileged, VPN/firewall, external and relevant non-human identities. Sources: S16
Page 30 · Breach economics are material—but global averages must
Breach economics are material—but global averages must stay global IBM’s 2026 study adds consequence and security-automation context. 602 $4.99M 56% $1.93M Breached organizations Global average breach cost Increase in AI-driven attacks Lower cost with extensive studied +12% [S17] IBM 2026 [S17] security AI/automation IBM/Ponemon 2026 [S17] vs none [S17] IBM’s 2026 Cost of a Data Breach research studied 602 organizations impacted by data breaches. The global mean was $4.99 million; IBM reports AI-driven attacks increasing 56% and $1.93 million lower costs among organizations making extensive use of security AI and automation compared with those using none. [S17] Do not localize improperly The report does not say “the average NJ SMB breach costs $4.99M.” IBM’s breached-organization sample, company-size mix, geography and cost methodology do not support that interpretation. IBM’s 2025 research also reported a striking AI-governance gap among organizations that had AI-related security incidents: 97% lacked proper AI access controls, and 63% lacked AI governance policies. Those findings are useful prior art, not a New Jersey prevalence estimate. [S18] Sources: S17 · S18
Chapter 4 · New Jersey Regulation & Sector Implications
Page 31 · New Jersey regulators are already examining AI and
New Jersey regulators are already examining AI and cybersecurity together The Bureau of Securities is explicitly testing both topics across nearly 800 advisory firms. ~800 AI + cyber Written Vendor NJ-registered investment adviser firms Joint examination focus controls diligence Sensitive data and emerging risk 2026 examination [S19] [S19] Cyber policies & procedures Ongoing third-party Requested [S19] cybersecurity due diligence Requested [S19] In June 2026, the New Jersey Bureau of Securities announced its annual examination of nearly 800 NJ-registered investment adviser firms would focus on protecting sensitive data and emerging AI risks. The examination seeks information about AI use and asks about cybersecurity practices including written policies and procedures, periodic employee training, and ongoing third-party vendor cybersecurity due diligence. [S19] What this does—and does not—prove The regulator’s questionnaire shows that AI and cybersecurity are now jointly material supervisory topics. It does not reveal how many firms passed or failed each control because the response results are not publicly reported. This is strong support for the report’s matched-design logic: in at least one regulated NJ sector, the state itself is treating AI adoption and cyber governance as linked risk-assessment questions. Sources: S19
Page 32 · New Jersey privacy law makes data governance a concrete
New Jersey privacy law makes data governance a concrete control question Reasonable security and data-minimization duties directly intersect with AI use. Legal requirement / theme Research measurement implication Ask whether AI use has defined data-purpose and minimization Limit collection to adequate, relevant, reasonably necessary data rules. Reasonable administrative, technical and physical safeguards Measure actual technical coverage, not policy existence alone. Protect confidentiality, integrity and accessibility during storage and Trace AI data paths, storage, connectors and downstream handling. use Identify whether sensitive data are permitted in AI workflows and Sensitive-data consent obligations on what basis. Capture whether relevant AI processing is assessed/documented Heightened-risk processing assessments before deployment. New Jersey’s 2023 privacy law requires reasonable administrative, technical, and physical data-security practices appropriate to the volume and nature of personal data. P.L. 2026, c.25, approved June 30, 2026, amended the regime while retaining these security duties and adding/clarifying provisions including sensitive-data treatment. [S20][S21] Not legal advice The research uses statutes to identify measurable governance dimensions. Whether a specific organization or AI use case is legally covered requires legal analysis of the facts, exemptions, definitions and effective provisions. Sources: S20 · S21
Page 33 · Enforcement deep dive: identity basics can fail
Enforcement deep dive: identity basics can fail catastrophically The Enzo case shows why AI governance cannot replace core cyber hygiene. 2.4M ~331,600 $4.5M MFA Patients affected nationwide New Jersey residents affected Multistate settlement Required for all user accounts 2023 breach [S22] [S22] NJ >$930K [S22] under settlement measures [S22] The New Jersey Attorney General’s 2024 Enzo Biochem settlement followed a 2023 ransomware breach affecting approximately 2.4 million patients nationwide, including about 331,600 New Jersey residents. State investigators described deficient data-security practices. The agreement required stronger controls and a $4.5 million payment. [S22] The case materials describe shared employee credentials, long-lived credentials and inadequate monitoring; the remedial requirements include stronger access policies, MFA, encryption, risk assessments and incident-response measures. These are exactly the foundational controls that should be tested alongside AI adoption. Research lesson A company can have sophisticated AI ambitions while still being exposed by basic identity or monitoring failures. Therefore, the study’s “security readiness” side must include foundational controls rather than only AI-specific policy questions. Sources: S22
Page 34 · Third-party risk is part of the AI security boundary
Third-party risk is part of the AI security boundary AI introduces vendors, connectors and data processors; breach evidence already shows the consequence of weak oversight. The New Jersey Attorney General’s Morgan Stanley settlement involved two data-security incidents affecting more than 3.37 million individuals nationwide, including 755,592 New Jersey residents, and centered on data disposal and vendor-management failures. The settlement imposed stronger security and disposal requirements. [S23] Verizon’s 2026 DBIR independently reports third-party involvement in 48% of breaches, up sharply year over year. [S14] AI vendor-risk field What to record Why approved_ai_vendor Vendor/product category + approval status Separates sanctioned from shadow use. data_classes_allowed None/public/internal/confidential/regulated Defines exposure boundary. connector_scope Mail/files/CRM/code/database/other Measures delegated access. vendor_review_date Most recent review Tests governance currency. Retention/training/subprocessor controls contract_data_terms Captures contractual data risk. documented? Supports response and third-party incident_notification_terms Yes/no/unknown coordination. Inference As AI shifts from standalone chat tools toward integrated agents and copilots, third-party governance becomes both a privacy issue and an identity/access issue. This is a research hypothesis about control importance—not a claim that AI caused the cited breaches. Sources: S14 · S23
Page 35 · Healthcare & life sciences: sensitive data raises the
Healthcare & life sciences: sensitive data raises the consequence of weak AI controls New Jersey’s sector mix makes privacy, identity and recovery controls especially consequential. Blueclone’s company materials identify healthcare, pharmaceutical and life-sciences organizations among its regulated-sector focus. New Jersey’s enforcement record, including Enzo, shows the consequence side of inadequate identity and data safeguards in a healthcare/lab context. [S22][S27] AI governance question Healthcare/life-sciences measurement What data enter AI tools? PHI/PII/clinical/HR/research data classes; permitted vs prohibited. Who can access AI workflows? Workforce, contractors, privileged users, service accounts. Where are prompts/outputs retained? Retention, logging, model training policy, data residency if relevant. Can sensitive content leave approved boundaries? DLP, upload restrictions, browser/SaaS controls. How are outputs reviewed? Human review for clinical, regulatory or business-critical use. Can systems recover after compromise? Backups + verified restores of critical workloads. Claim boundary This report does not infer that New Jersey healthcare AI adopters are less secure than other sectors. It argues that the consequence of governance failure can be higher when regulated or sensitive data are involved. Sources: S22 · S27 · S20
Page 36 · Financial services: AI adoption is high and supervision is
Financial services: AI adoption is high and supervision is explicit National adoption and New Jersey examination evidence make finance a high-value matched cohort. 33.9% ~800 AI use Cyber U.S. finance/insurance AI use NJ investment adviser firms in 2026 exam Regulator asks about emerging AI risk controls May 2026 [S2] [S19] [S19] Policies, training, vendor diligence [S19] Finance and insurance had one of the highest national AI-use rates in Census BTOS at 33.9%. In New Jersey, the Bureau of Securities’ 2026 examination explicitly pairs AI-use questions with cybersecurity and sensitive-data controls for nearly 800 investment adviser firms. [S2][S19] Best sector hypothesis Among New Jersey financial-services firms using AI, the most newsworthy measurement is not whether a policy exists in isolation, but whether approved AI use is backed by complete identity coverage, documented vendor review, controlled sensitive-data paths, monitoring and tested incident/recovery procedures. This sector also demonstrates why firm-level matching matters. A high adoption rate does not imply weak security; regulated firms may have stronger baseline governance. Only the matched study can reveal whether control maturity keeps pace. Sources: S2 · S19
Page 37 · Legal and professional services: high adoption potential,
Legal and professional services: high adoption potential, confidentiality stakes Knowledge work amplifies both AI utility and data-governance sensitivity. Census-based sector data show professional, scientific and technical services among the higher-adoption categories nationally. New York Fed regional evidence similarly reports highest use in knowledge-intensive sectors such as information, business services and finance. [S4][S5] Risk surface Example measurement Policy on pasting client documents into AI; DLP coverage; approved Client confidentiality vendors. Matter/work-product data Sensitivity labeling and external-sharing controls. Research/drafting outputs Human-review requirements and source verification. MFA coverage across Microsoft 365, VPN, file systems and AI Identity connectors. Third parties AI vendor due diligence and subprocessors. Auditability Logs for tool access, data movement and administrative changes. Why this cohort matters Professional-services firms often combine high-value information with smaller IT teams. That makes them useful for testing whether adoption intensity, company size and managed-security maturity interact. The study should not assume the result in advance. Sources: S4 · S5 · S27
Chapter 5 · Synthesis, Answer & Original Contribution
Page 38 · Cross-dataset proof matrix
Cross-dataset proof matrix Which parts of the “outrunning security” proposition are actually observed? Proposition Evidence today Status What would close the gap NJ businesses are using AI at 18.5% current; 20.5% planned in Direct official state-cell extraction SUPPORTED material scale Census-based state extraction for final audit trail. Adoption is concentrated in Census + NY Fed sector/size NJ-specific sector × size cells if SUPPORTED larger / knowledge sectors patterns available. Cyber pressure on NJ NJCCIC incidents, breaches, No additional evidence required SUPPORTED organizations is material credentials; FBI losses for descriptive claim. Security/privacy constrains some Third District + NY Fed regional NJ-only business survey for state SUPPORTED regionally AI adoption survey responses estimate. NJ AI adopters lack adequate Telemetry/survey in same No matched public denominator UNKNOWN controls adopting organizations. AI adoption causes more NJ Longitudinal/causal study with No causal design NOT ESTABLISHED breaches confounder control. Security controls reduce AI-related Incident/outcome panel; external No NJ causal estimate UNKNOWN loss in NJ benchmarks only. PUBLICATION-SAFE CONCLUSION The answer in one sentence AI adoption is expanding into a demonstrably high-pressure security environment, but the public evidence does not yet prove that security controls are lagging adoption within the same New Jersey businesses. Sources: S4 · S5 · S6 · S8 · S9 · S14 · S15 · S17
Page 39 · Answer to the research question
Answer to the research question The strongest conclusion is a measured “not yet proven,” not a weak result. The question “Is AI adoption outrunning security in New Jersey businesses?” contains two measurable trajectories: adoption and control maturity. The adoption trajectory is now visible. The control-maturity trajectory is not publicly measured with a comparable NJ business denominator. What the evidence supports AI adoption is established and uneven; high-adoption pockets are already substantial. Cyber incidents, credential exposure and reported losses in New Jersey are material. Security/privacy is a reported adoption challenge for some regional small businesses. State regulators are already asking firms about AI and cybersecurity together. What the evidence does not support A statewide percentage of AI adopters lacking controls; a claim that AI caused New Jersey’s incident or loss growth; a claim that 71% of NJ firms suffered identity breaches; a claim that the average NJ SMB breach costs $4.99M; or a subtraction of adoption and security figures from unrelated samples. The missing measurement is itself publishable white space. A rigorously designed matched cohort could turn a broad policy/security question into an original benchmark that Census, NJCCIC, FBI, and vendor studies cannot answer individually. Sources: S4 · S6 · S8 · S9 · S17 · S19
Page 40 · Unexpected and null findings
Unexpected and null findings The evidence does not support a simple “AI = immediate workforce or security collapse” narrative. AI use can be broad at the organization level while shallow inside the workforce: median worker penetration among adopting regional service firms was 17% and manufacturing 7%. [S5] Most regional adopters described AI investment as minimal or modest, which suggests experimentation and partial deployment remain common. [S5] New York Fed research found layoffs attributable to AI remained uncommon; only 4% of service firms reported AI-related layoffs and none of the manufacturers did in that survey. [S5] Security/privacy concerns can slow adoption: more than one-third of regional nonadopters cited privacy/security/confidentiality concerns. [S5] Third District AI users report data security/privacy as a challenge, but 28% reported no AI-related challenges at all. [S6] High AI adoption in finance and knowledge sectors does not demonstrate lower security maturity; regulation may push in the opposite direction. Why null findings matter A credible study must allow the possibility that controls keep pace, or that security-conscious firms adopt more slowly. If matched telemetry shows no governance gap—or a smaller one than expected—the conclusion must change with the evidence. Sources: S5 · S6 · S19
Page 41 · Prior art: New Jersey AI research exists, but the matched
Prior art: New Jersey AI research exists, but the matched cyber-control benchmark is still open Originality comes from the join, not from claiming nobody has studied AI adoption. Rutgers’ New Jersey State Policy Lab and the Heldrich Center launched research in 2026 on how New Jersey public AI initiatives can better meet the needs of small businesses, particularly minority- and women-owned firms. The work includes focus groups, labor-market analysis and literature review and explicitly identifies small businesses as underrepresented in AI-related research. [S25][S26] That work is important prior art for adoption needs and policy. It does not duplicate the study proposed here: a quantitative, organization-level benchmark joining AI use to technical/security controls such as MFA coverage, DLP, vendor governance, patch latency, monitoring and tested recovery. Prior evidence What it contributes What remains open Census BTOS State/sector/size AI adoption Matched cyber controls. NY/Philly Fed Regional adoption, workforce, challenges NJ-only matched control maturity. NJ small-business needs and qualitative Rutgers/Heldrich Operational control benchmark. context Whether AI adopters are better/worse NJCCIC/FBI Threats, incidents, reported loss controlled. NIST/vendor research Control frameworks and global benchmarks NJ prevalence by business cohort. Sources: S25 · S26 · S1 · S5 · S6 · S8 · S9
Page 42 · Original contribution: a matched New Jersey AI-governance
Original contribution: a matched New Jersey AI-governance benchmark The study becomes genuinely original when adoption and controls share the same denominator. Proposed contribution Create a privacy-preserving panel of New Jersey employer organizations where AI use, approved-tool status, policy, MFA, DLP, patching, backup/recovery, vendor review and monitoring are assessed within a common observation window. Compare adopters with nonadopters and publish sector/size cohorts where sample size permits. 1. Benchmark NJ AI adoption against Census/Federal Reserve external data. 2. Measure organization-level minimum-control pass rates among AI adopters. 3. Compare adopter vs nonadopter control maturity without implying causation. 4. Test whether governance gaps vary by sector and company size. 5. Normalize identity incidents by monitored user-months where data quality allows. 6. Publish numerator, denominator, missingness and minimum cell-size rules. 7. Repeat on a fixed cadence to test whether controls catch up as adoption expands. HYPOTHESIS-TO-HEADLINE GATE Potential media result — only after measurement “X% of AI-adopting New Jersey businesses in the assessed sample lacked at least one minimum governance control.” X should not exist until the real numerator and denominator are calculated. Sources: Method: S31 · external benchmarks: S1 · S5 · S6
Page 43 · Red-team analysis: alternative explanations and confounders
Red-team analysis: alternative explanations and confounders A security gap can be manufactured statistically if the study ignores who adopts AI. Potential confounder How it could distort the result Mitigation Larger firms adopt more AI and may also have Firm size Stratify/multivariable adjustment. stronger controls. Finance/healthcare may have both high Industry Industry fixed effects / matched cohorts. adoption and regulation. Blueclone clients may be more security-mature Describe sample; external weighting only if Managed IT selection than NJ average. defensible. Observation coverage Missing DLP telemetry can look like “no DLP.” Separate unknown from absent. Tool intensity One-off AI drafting ≠ agentic production use. Measure adoption intensity. Security investment More mature firms may adopt AI sooner. Measure baseline maturity / pre-period. Organizations with mature programs Normalize and interpret incident rate Reporting propensity detect/report more incidents. cautiously. Adoption and control snapshots from different Time alignment Use common observation windows. periods can mislead. Conditions that would weaken the hypothesis If AI adopters have equal or stronger complete-control coverage than comparable nonadopters after size/sector adjustment—or if gaps disappear under reasonable missing-data treatments—the “outpacing” hypothesis should be weakened or rejected. Sources: S31
Chapter 6 · Methodology & Matched Study Design
Page 44 · Full methodology
Full methodology A reproducible matched-cohort design for the next-stage empirical test. Design element Specification Among assessed NJ employer organizations, what share of current AI adopters Primary question lacks the predefined minimum control set? NJ employer organizations in sampling frame; separately report Blueclone- Population managed/assessed population if convenience sample. Organization/tenant; secondary account/device/workload units roll up to Unit of analysis organization. Exposure Current AI use in any business function; intensity tier if available. Primary outcome Governed AI Adoption Rate / Governance Gap Rate. Complete MFA, DLP coverage, vendor review, patch latency, tested recovery, Secondary outcomes monitoring. Comparison groups Adopters vs nonadopters; industry; size bands; regulated vs other. Prefer 12 months of telemetry with point-in-time governance survey aligned to Window end date. Inclusion NJ geography, valid org ID, minimum observation coverage. Duplicates, test tenants, insufficient observation period, unverifiable Exclusion geography. Missingness Unknown ≠ absent; report variable-specific denominators. Weighted descriptive rates where justified; Wilson/robust CIs; logistic models Statistics only if sample supports. Recompute denominators, inspect outliers, sensitivity analyses, red-team Validation alternative explanations. Primary principle Use the simplest defensible method. A transparent cross-tab with correct denominators is better than an unstable multivariable model on a small convenience sample. Sources: S31
Page 45 · Statistical treatment & sensitivity plan
Statistical treatment & sensitivity plan The analysis should quantify uncertainty without pretending convenience data are representative. For survey-derived proportions, report weighted estimate, unweighted N where available, denominator definition and confidence interval consistent with survey design. For Blueclone telemetry, report exact organization counts and percentages; do not apply statewide population weights unless the sample design supports them. Use organization-level pass/fail outcomes alongside account-level coverage rates so 99% account coverage does not hide incomplete organizational coverage. Use Wilson intervals for simple binomial proportions when survey design weights are not involved and cell sizes are adequate. Predefine minimum publication cell size (for example, n≥20 organizations) and combine/suppress smaller cohorts. Run sensitivity analysis treating missing controls as (a) unknown/excluded, (b) absent, and (c) present where documentation supports; publish the range if conclusions change. If modeling adopter vs nonadopter differences, control for size and industry at minimum; consider managed-service tenure and baseline maturity if available. For incident rates, normalize by user-months or organization-months and avoid causal language unless temporal ordering and confounding are addressed. Meaningful finding criterion A statistically detectable difference is not automatically operationally meaningful. Publish absolute percentage-point differences, denominators and confidence intervals alongside p-values/effect estimates where used. Sources: Methodology specification: S31
Page 46 · Proposed matched New Jersey study
Proposed matched New Jersey study The public-data report becomes a first-party benchmark with one privacy-preserving export and one short governance survey. Workstream Operational data Survey data Output ai_use_current; approved AI Use cases; employee access; public Adoption Adopter denominator + intensity. inventory vs enterprise/private eligible/protected accounts; Identity Exception governance Complete MFA + identity maturity. privileged/NHI; risky sign-ins DLP in-scope/covered; sensitivity Permitted/prohibited data; vendor Data Controlled data-path rate. labels; external sharing data terms asset count; OS lifecycle; critical Exposure / remediation Endpoint — patch lag distribution. backup coverage; restore-test Recovery Recovery ownership Proven recovery rate. date/result Policy; training; output review; Governance Tool inventory if operational AI governance pass rate. executive ownership identity incident count; Known AI-related incidents if Incidents Normalized incident context. observation months validated Privacy by design No raw prompts, message content, customer documents, usernames, patient/client data, or other personally identifiable content is required for this research question. Use stable randomized organization IDs and aggregated control counts. Sources: Proposed research design derived from S11 · S12 · S31
Page 47 · Data dictionary: minimum fields for reproducible analysis
Data dictionary: minimum fields for reproducible analysis The final dataset should make every numerator and denominator explicit. Field Format / granularity Purpose Priority org_id_hash Stable random ID Join records without client name Essential state NJ / PA / NY / other Define cohort Essential industry_naics 2–3 digit Sector comparison Essential employee_band Census-compatible Size comparison Essential ai_use_current Yes/No/Unknown + date Adopter definition Essential ai_policy_status Approved/Draft/None/Unknown Governance Essential ai_tools_approved Count/categories Approved path Essential mfa_eligible_accounts Count Identity denominator Essential mfa_protected_accounts Count Identity numerator Essential privileged_accounts Count + protected count if possible Elevated access High legacy_auth_enabled Yes/No/count Identity exposure High dlp_in_scope_users Count DLP denominator Essential dlp_covered_users Count DLP numerator Essential endpoint_count Managed valid assets Endpoint denominator Essential critical_patch_lag_days Device/CVE or quantiles Remediation maturity Essential backup_workloads Count Recovery denominator High successful_backup_workloads Count Nominal protection High restore_test_date/result Date + pass/fail/partial Actual recoverability Essential identity_incident_count Monthly Incident numerator High user_months_monitored Monthly Rate denominator High observation_start/end Dates Exposure window Essential Sources: Proposed fields; no fabricated data. Method basis: S31.
Page 48 · Publication-safe claims—and claims that should not be
Publication-safe claims—and claims that should not be published The report is designed to be quoted without overstating the evidence. Safe now Do not publish yet A Census-based analysis reports 18.5% current AI use among NJ “X% of NJ AI adopters lack proper governance.” No matched control businesses in May 2026. [S4] denominator exists. AI use is substantially higher in larger and information-intensive U.S. “AI adoption is causing New Jersey cyber incidents to rise.” No causal business groups. [S2][S4] evidence. NJCCIC received 954 incident reports in 2025, up 92%. [S8] “954 NJ businesses were breached.” Incidents ≠ unique businesses. “94,168 NJ employees were hacked.” Notifications ≠ unique NJCCIC issued 94,168 compromised-credential notifications in 2025. [S8] people/incidents. “The average NJ SMB breach costs $31,984 or $4.99M.” Neither IC3 records $660.4M in reported NJ complaint losses in 2025. [S9] denominator supports that. “25% of NJ AI users have inadequate security.” Concern ≠ control failure Third District AI users report data security/privacy as one challenge. [S6] and region ≠ NJ-only. NJ regulators are examining AI and cybersecurity together in investment “NJ advisers have widespread AI control failures.” Examination results advisers. [S19] are not public. JOURNALIST-SAFE FRAMING Preferred headline today “AI Use Is Material in New Jersey as Cyber Incident Reports Nearly Double—But No Public Benchmark Yet Shows Whether Business Security Controls Are Keeping Pace.” Sources: S4 · S8 · S9 · S19
Page 49 · Journalist guidance & dashboard blueprint
Journalist guidance & dashboard blueprint Readers should be able to see the denominators behind every chart. Journalist-ready framing A Census-based analysis reports 18.5% of New Jersey businesses using AI in May 2026, while NJCCIC recorded a 92% rise in incident reports during 2025. Regional Federal Reserve evidence shows much higher AI use in knowledge-intensive businesses and identifies data security/privacy as an adoption challenge. The missing number is the most important one: no public dataset currently shows what share of NJ AI adopters has complete governance and security controls. Dashboard module Data / chart Required disclosure Overview NJ current/planned AI; NJ incidents; IC3 loss Source, period, denominator, evidence label. Adoption explorer State/sector/size adoption Question wording + series break. Security pressure NJCCIC incidents, breaches, credentials Report counts ≠ businesses. Control explorer Policy, MFA, DLP, recovery by cohort Numerator + denominator on hover. Matched gap Governed Adoption Rate Only when same organizations measured. Methods Sampling, definitions, missingness, CI rules Versioned methodology. Sources Direct source links and downloads Publisher/date/coverage. Aggregate CSV + data dictionary where Downloads Privacy/suppression rules. publishable Visual rule Every quantitative visual should state the source, sample/population, denominator, period, and whether values are observed or derived. Unknowns should render as unknown—not zero. Sources: Dashboard specification: S31
Chapter 7 · Sources, Evidence Ledger & Research Trace
Page 50 · Source ledger · Part 1
Source ledger · Part 1 Primary/public adoption, government and methodological sources. ID Source Publisher / class Period · use Key limitation AI supplement Nov 17, 2025– Business Trends and Outlook U.S. Census Bureau · Feb 8, 2026 · BTOS Sample frame ≠ completed S1 Survey Data Release — May 7, Government primary methodology; responses. 2026 state/industry/size availability Data through May 3, 2026 · Large Firms With at Least 20 U.S. Census Bureau · S2 National, sector, firm-size AI Not a direct NJ cell table. Employees Biggest AI Users Government primary analysis findings; wording change U.S. Census Bureau · 2026 AI supplement · Question BTOS AI Supplement S3 Government primary definitions and implementation Instrument, not results. Questionnaire instrument variables Big Companies Are Racing May 2026 BTOS · NJ 18.5% LendingTree · Secondary NJ estimate used via secondary S4 Ahead on AI — but Few Are current / 20.5% planned; analysis of Census extraction of official data. Cutting Jobs state/size/sector tables Aug. 2026; trend 2024–26 · Businesses Are Using AI to Federal Reserve Bank of New NY/Northern NJ AI adoption, S5 Regional, not NJ-only. Transform Work, Not Cut Jobs York · Federal Reserve research investment depth, workforce effects Small Business Credit Survey: Federal Reserve Bank of Fall 2025 · N=894 Third District AI module region-only at S6 2026 Insights into the Third Philadelphia · Federal Reserve small employers; AI publication. District Region survey use/challenges 2023 business data · Employer U.S. Census Bureau · S7 QuickFacts: New Jersey firms, establishments, General business context. Government primary employment, payroll Information cutoff Dec. 31, 2025 Reporting dataset; 2026 New Jersey Statewide NJ OHSP / NJCCIC · State · 954 incidents; 1,951 breach S8 underreporting; not business Threat Assessment government primary reports; 94,168 credential prevalence. notifications Calendar 2025 · NJ Federal Bureau of Investigation Reported complaints; mixes S9 2025 IC3 Annual Report complaints/loss; AI-related · Federal government primary people/orgs; not all cybercrime. national complaints/loss Federal Bureau of Investigation Calendar 2024 · Baseline for NJ S10 2024 IC3 Annual Report Same reporting limitations. · Federal government primary complaint/loss trend Sources: Direct URLs are listed in the next appendix page to preserve reproducibility.
Page 51 · Source ledger · Part 2
Source ledger · Part 2 Security frameworks, industry benchmarks, state regulation and prior art. ID Source Publisher / class Use Limitation Cross-sector security outcome S11 Cybersecurity Framework 2.0 NIST · Government standard Framework, not prevalence data. structure Cybersecurity Framework Profile S12 for Artificial Intelligence (Cyber AI NIST · Government draft AI cybersecurity risk governance Draft; not final standard. Profile), preliminary draft AI Risk Management Framework: S13 NIST · Government guidance AI risk categories/actions Voluntary guidance. Generative AI Profile 31K+ incidents / 22K+ breaches; 2026 Data Breach Investigations Verizon · Industry incident Incident corpus, not S14 initial access, ransomware, third Report research representative NJ business survey. parties N=5,000; identity breach/control Multinational vendor- S15 State of Identity Security 2026 Sophos · Industry survey context commissioned survey. N=2,158 ransomware-hit orgs; S16 State of Ransomware 2026 Sophos · Industry survey Victim-only sample. attack paths and MFA coverage IBM / Ponemon · Industry breach N=602 breached orgs; global cost S17 Cost of a Data Breach Report 2026 Global breached-org sample. study and AI attack context IBM / Ponemon · Industry breach AI oversight gap among incident- Global; affected-organization S18 Cost of a Data Breach Report 2025 study reporting orgs context. NJ Bureau of Securities 2026 NJ Office of Attorney General · Nearly 800 NJ RIAs; AI + S19 Exam results not public. Investment Adviser Examination State regulatory primary cybersecurity questions New Jersey Legislature · State law Data minimization, security, Applicability depends on legal S20 P.L. 2023, c.266 primary privacy obligations definitions/exemptions. New Jersey Legislature · State law Privacy-law amendments incl. S21 P.L. 2026, c.25 Legal interpretation outside scope. primary sensitive data Enzo Biochem multistate data- NJ Office of Attorney General · 2.4M patients; ~331.6K NJ; S22 Case-specific; not prevalence. security settlement State enforcement primary required controls Morgan Stanley data-security NJ Office of Attorney General · Vendor/disposal risk; NJ affected S23 Case-specific. settlement State enforcement primary population NJ Office of Attorney General · MFA/security program S24 Weichert cybersecurity settlement Historical case-specific. State enforcement primary remediation An Examination of Artificial NJ State Policy Lab / Rutgers · NJ small-business AI needs S25 Intelligence and Small Businesses Study project/qualitative focus. Academic/policy prior art research in New Jersey The Voices of Small Business NJ State Policy Lab / Heldrich · Focus-group progress / small- S26 Localized qualitative sample. Owners in Middlesex County Academic/policy prior art business AI experience CEO Message / company Blueclone Networks · Company- Milan Baria role/history/sector S27 Company-provided biography. background provided context focus Clutch · Third-party business Legal entity verification; 10 Commercial review platform; not S28 Blueclone Networks profile profile verified reviews research evidence.
Page 52 · Evidence ledger
Evidence ledger Each headline claim has a traceable support path and a visible boundary. Confidence / Claim Source Class Period Method boundary High, provenance caveat · Direct Census cell should NJ current AI use = 18.5%; Secondary extraction of S4 Observed May 2026 replace secondary planned = 20.5% Census BTOS state table extraction in final data archive. U.S. current AI use = High · Question definition S2 Observed May 3, 2026 Census published analysis 19.8% changed Nov. 2025. High · National sectors, Info 39.7%; finance 33.9% S2 Observed May 3, 2026 Census published analysis not NJ sectors. Regional High · NY + Northern NJ service/manufacturing AI S5 Observed Aug. 2026 NY Fed regional survey region. use = 61%/51% Third District current AI Weighted SBCS regional High · DE/NJ/PA; not state- S6 Observed Fall 2025 use = 37% module specific. 25% of AI users cite data Challenge question High · Regional; question security/privacy S6 Observed Fall 2025 among AI users denominator = AI users. challenge NJCCIC incidents = 954; State threat-assessment High · Reported incidents; S8 Observed 2025 +92% operational reports underreporting. Breach reports = 1,951; Initial breach reports High · Not unique NJ S8 Observed 2025 ransomware 813 affecting NJ residents businesses. Credential notifications = High · Notifications ≠ S8 Observed 2025 NJCCIC notifications 94,168; +235% unique people/events. NJ IC3 complaints = High · Complaint data; not S9 Observed 2025 FBI state table 20,648 business-only. NJ IC3 losses = $660.4M; S9 Observed 2025 FBI state loss table High · Reported loss only. rank 5 NJ complaints +31.5%; High · Aggregate S9,S10 Derived 2024→2025 Simple arithmetic loss +51.9% composition may change. Verizon vulnerability High · Global breach S14 Observed 2026 DBIR period Incident corpus initial access = 31% corpus. Sophos identity breach = N=5,000 multinational High · Not NJ S15 Observed 2026 71% survey representative. IBM global average N=602 breached High · Do not localize to S17 Observed 2026 breach cost = $4.99M organizations NJ SMB. Statewide NJ AI No matched public Unknown · Requires — Unknown Current governance gap denominator telemetry/survey.
Page 53 · Research trace: what was searched, used, and rejected
Research trace: what was searched, used, and rejected Reproducibility includes documenting evidence gaps and sources that were not fit for the claim. Category What was examined Decision Census BTOS releases, Used as adoption backbone; state NJ cell Official adoption methodology/instrument, state/sector/size retained with secondary-extraction outputs provenance. NY Fed regional business surveys; Philadelphia Used for regional trend, adoption depth and AI Federal Reserve Fed SBCS security/privacy concern. 2026 Statewide Threat Assessment / NJCCIC Used for NJ incidents, breach reports and NJ government threat data metrics credentials. Used for NJ complaint/loss trend and national Federal cybercrime FBI IC3 2024–2025 reports AI-related descriptor. Used to define measurable control domains; not Frameworks NIST CSF 2.0; AI/Cyber AI guidance prevalence. Used as context and control priorities; not NJ Industry studies Verizon, Sophos, IBM estimates. Used to show expectations/consequence; not State regulation/enforcement Bureau of Securities, privacy statutes, AG cases control prevalence. NJ prior art Rutgers/Heldrich NJ small-business AI research Used to define originality boundary. Company background and public third-party Blueclone materials Used only for leadership/entity context. profile MFA/DLP/patch/recovery/customer control NOT AVAILABLE in supplied materials; no Blueclone telemetry exports customer findings invented. Important rejected uses Older Census AI percentages were rejected as a continuous comparator because the question changed. Global vendor percentages were rejected as New Jersey prevalence estimates. IC3 loss averages were rejected as typical business-breach costs. Incident counts were rejected as unique-company denominators. Sources: S1–S28 · project method S31
Page 54 · Limitations & claim boundaries
Limitations & claim boundaries The report is strongest when its unknowns are as explicit as its findings. New Jersey state adoption provenance: the 18.5% / 20.5% cells are taken from a published LendingTree extraction of the official Census BTOS data rather than a direct machine-readable Census cell in this research environment. No matched control denominator: public evidence does not measure AI adoption and security-control maturity in the same NJ businesses. Regional surveys: NY Fed covers New York and Northern New Jersey; Philadelphia Fed AI module covers the Third District. Neither is a state-only NJ AI/security estimate. Reporting bias: NJCCIC and IC3 rely on reported incidents/complaints; actual cyber activity is not fully observed. Population mismatch: Verizon incidents, Sophos surveys and IBM breached organizations differ from the NJ employer- business population. Selection bias: future Blueclone telemetry would represent managed/assessed organizations, not automatically all NJ businesses. Observation bias: a control can only be scored if observable; missing telemetry must stay unknown rather than silently become failure. Account vs organization denominators: high account-level MFA coverage can coexist with many organizations having at least one unprotected critical service. Temporal alignment: adoption, incident and control data must be aligned to a defined observation window before trend claims are made. Legal scope: statutory summaries are research context and not legal advice. Causality: the study describes adoption, risks and control gaps; it does not establish that AI causes breaches without a stronger longitudinal or experimental design. Publication boundary The most important unsupported sentence remains: “AI adoption is outrunning security in New Jersey businesses.” Until matched controls are measured, the correct language is that the evidence makes the hypothesis serious, measurable and timely—but not yet proven statewide. Sources: S1 · S4 · S5 · S6 · S8 · S9 · S14 · S15 · S17
Page 55 · About the research leadership & research team
About the research leadership & research team Credentials are context; evidence and reproducibility remain the basis for the report. Milan Baria · Founder & CEO, Blueclone Networks Blueclone’s public company materials identify Milan Baria as founder and CEO and state that he founded the firm in 2006 after enterprise IT work in pharmaceutical and healthcare settings. Blueclone describes its focus as managed IT, cybersecurity, compliance, Microsoft 365, cloud and related services, with particular experience in regulated or security- conscious sectors. [S27] Independent company verification Clutch’s current profile lists Blueclone Networks, LLC as a New Jersey entity formed May 15, 2006, active, headquartered in Princeton, and Premier Verified. The profile showed 10 verified reviews averaging 5.0 at its July 22, 2026 update. This is organization-level third-party context, not validation of the findings in this report. [S28] Research methodology This report follows the supplied Research Execution Protocol: primary/raw sources first, explicit evidence classes, denominator discipline, source/evidence ledgers, prior-art review, contradictory-evidence search, reproducible calculations, and visible publication boundaries. The attached 24-page initial report and research-selection dashboard were treated as starting briefs; the 32-page NytroSEO report was used as a structural design reference, not as evidence for the NJ AI/security findings. [S29][S30][S31][S32] BOTTOM LINE New Jersey businesses are adopting AI at material scale, with much faster uptake in some regional and knowledge- intensive cohorts. At the same time, cyber incident reports, credential exposure, reported losses and regulatory attention are substantial. What remains unmeasured is the decisive denominator: among the same NJ organizations using AI, how many have complete policy, identity, data, vendor, patching, monitoring and recovery controls? That is the next publishable study. Sources: S27 · S28 · supplied files: S29–S32
Page 56 · Direct source references & project materials
Direct source references & project materials URLs and attached-file provenance for reproducibility. S1 · Business Trends and Outlook Survey Data Release — May 7, 2026 https://www.census.gov/newsroom/press-releases/2026/btos-may-7.html S2 · Large Firms With at Least 20 Employees Biggest AI Users https://www.census.gov/library/stories/2026/05/ai-use-businesses.html S3 · BTOS AI Supplement Questionnaire https://www2.census.gov/data/experimental-data-products/business-trends-and-outlook-survey/questionnaire-ai-supplement.pdf S4 · Big Companies Are Racing Ahead on AI — but Few Are Cutting Jobs https://www.lendingtree.com/business/small/ai-business-study/ S5 · Businesses Are Using AI to Transform Work, Not Cut Jobs https://libertystreeteconomics.newyorkfed.org/2026/09/businesses-are-using-ai-to-transform-work-not-cut-jobs/ S6 · Small Business Credit Survey: 2026 Insights into the Third District Region https://www.philadelphiafed.org/community-development/credit-and-capital/small-business-credit-survey-2026-insights-into-the-third-district-region S7 · QuickFacts: New Jersey https://www.census.gov/quickfacts/fact/table/NJ/SBO030222 S8 · 2026 New Jersey Statewide Threat Assessment https://cdn-assets.fedwebplatform.org/fed-110/2/2026_NJ_Threat_Assessment.pdf S9 · 2025 IC3 Annual Report https://www.ic3.gov/AnnualReport/Reports/2025_IC3Report.pdf S10 · 2024 IC3 Annual Report https://www.ic3.gov/AnnualReport/Reports/2024_IC3Report.pdf S11 · Cybersecurity Framework 2.0 https://www.nist.gov/cyberframework S12 · Cybersecurity Framework Profile for Artificial Intelligence (Cyber AI Profile), preliminary draft https://csrc.nist.gov/pubs/ir/8596/iprd S13 · AI Risk Management Framework: Generative AI Profile https://doi.org/10.6028/NIST.AI.600-1 S14 · 2026 Data Breach Investigations Report https://www.verizon.com/business/resources/reports/dbir/ S15 · State of Identity Security 2026 https://www.sophos.com/en-us/blog/sophos-state-of-identity-security-2026 S16 · State of Ransomware 2026 https://www.sophos.com/en-us/content/state-of-ransomware S17 · Cost of a Data Breach Report 2026 https://www.ibm.com/reports/data-breach S18 · Cost of a Data Breach Report 2025 https://www.ibm.com/reports/data-breach S19 · NJ Bureau of Securities 2026 Investment Adviser Examination https://www.njoag.gov/new-jersey-bureau-of-securities-annual-examination-of-investment-advisers-will-look-closely-at-ai-and-cybersecurity/ S20 · P.L. 2023, c.266 https://pub.njleg.gov/Bills/2022/PL23/266_.HTM S21 · P.L. 2026, c.25 https://pub.njleg.gov/Bills/2026/AL26/25_.HTM S22 · Enzo Biochem multistate data-security settlement https://www.njoag.gov/attorney-general-platkin-and-multistate-coalition-secure-4-5-million-from-enzo-biochem-for-failing-to-protect-health-data/ S23 · Morgan Stanley data-security settlement https://www.njoag.gov/ag-platkin-new-jersey-to-receive-1-27-million-in-multistate-settlement-with-morgan-stanley-over-data-security-incidents-that-compromised-personal- information-of-millions-of-individuals-nationwide/ S24 · Weichert cybersecurity settlement https://www.njoag.gov/acting-ag-platkin-reaches-settlement-with-real-estate-and-financial-group-over-data-breach-and-inadequate-cybersecurity-measures/ S25 · An Examination of Artificial Intelligence and Small Businesses in New Jersey https://policylab.rutgers.edu/publication/an-examination-of-artificial-intelligence-and-small-businesses-in-new-jersey/ S26 · The Voices of Small Business Owners in Middlesex County https://policylab.rutgers.edu/publication/the-voices-of-small-business-owners-in-middlesex-county/ S27 · CEO Message / company background https://www.blueclone.com/ceo-message/ S28 · Blueclone Networks profile https://clutch.co/profile/blueclone-networks S29–S32 · Project materials supplied with this project: initial selected-topic research brief; validated research-selection dashboard; Research Execution Protocol; NytroSEO 170M+ URL report used only as a structural design reference.


